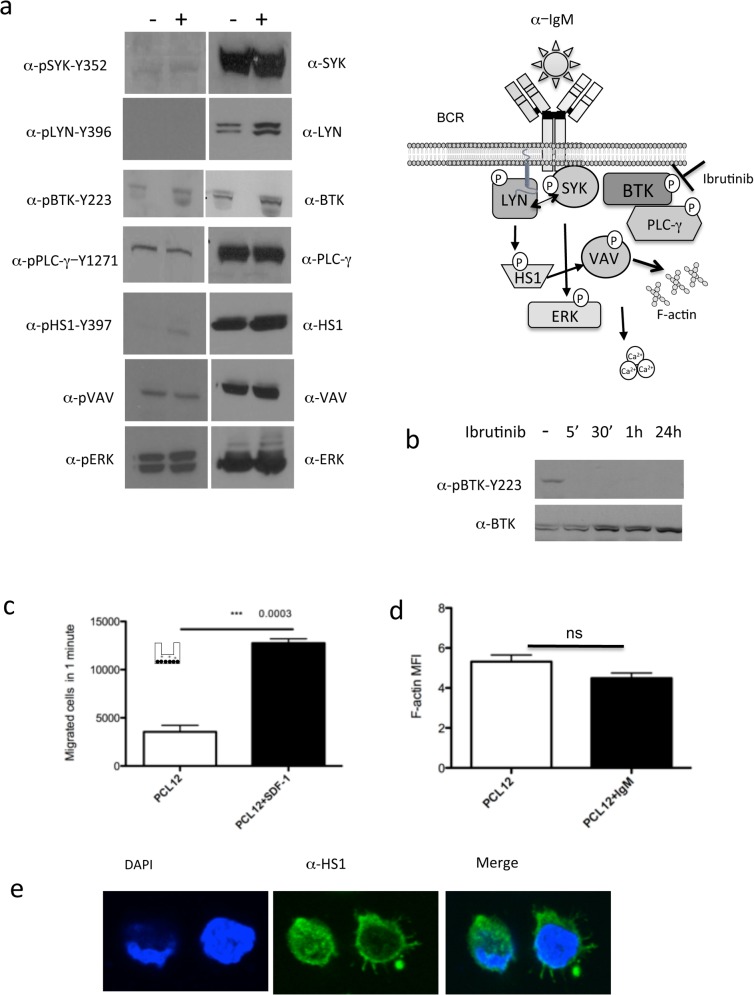
Fig 3. (a) WB analysis of PCL12 cells, basal (-) and after IgM stimulation (+), for BCR signaling pathway proteins activation and expression.
On the right a schematic representation of the BCR signaling pathway analyzed. (b) WB analysis after treatment with ibrutinib (5’, 30’, 1 hour, 24 hour) for BTK activation.(c) Transwell PCL12 migration assay of migration with and without SDF-1 stimulation. (d F-actin polymerization index on PCL12 cells in basal conditions and after IgM stimulation (e) confocal analysis of PCL12 cells stained for HS1 protein in green and DAPI in blue.

