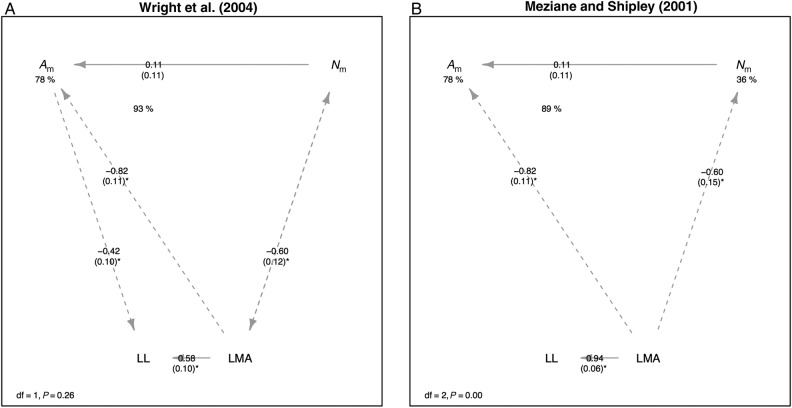
Figure 3.
Empirical evaluation of five possible models for the LES: (A) the model of Wright et al. (2004), (B) the model of Meziane and Shipley (2001), (C) the model of Shipley et al. (2006), (D) the venation model of Blonder et al. (2011) and (E) the revised venation-associated model of Blonder et al. (2013). Labels on arrows indicate standardized path coefficients, with standard errors in parentheses and an asterisk if significant at the α < 0.05 level. Paths are drawn with solid line if positive and dashed if negative. Values under dependent variables indicate R2 values. The overall model degrees of freedom and lack-of-fit P-value are shown in the legend; larger P-values indicate that the model is less likely to be rejected by observed data. Models are calculated using log10-transformed genotype-mean trait data.

