Figure 3.

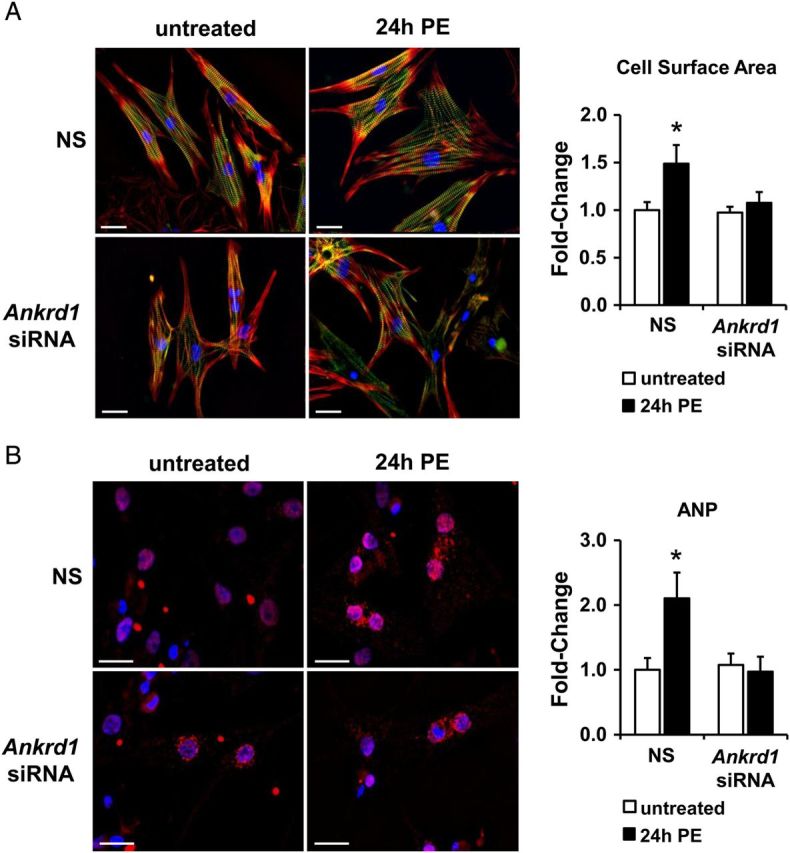
ANKRD1 knockdown attenuates PE-induced cardiomyocyte hypertrophy. (A) Representative images of NRVM showed an increase in cell area with 100 µM PE for 24 h, which was attenuated in cells pre-transfected with Ankrd1 siRNA. NRVM were immunostained for myomesin (green), DAPI (blue), and filamentous actin (red). Cell area was quantified and values expressed as mean ± SEM, n = 4–5, *P < 0.05 vs. untreated non-silencing (NS) control. Scale bar = 25 µm. (B) Representative images of cardiomyocytes treated with 100 µM PE for 24 h showed an increase in ANP levels (red), which is blunted in Ankrd1 siRNA cells. NRVM nuclei were stained with DAPI (blue) and ANP staining was quantified and values expressed as mean ± SEM, n = 4–5, *P < 0.05 vs. untreated non-silencing (NS) control. Scale bar = 20 µm.
