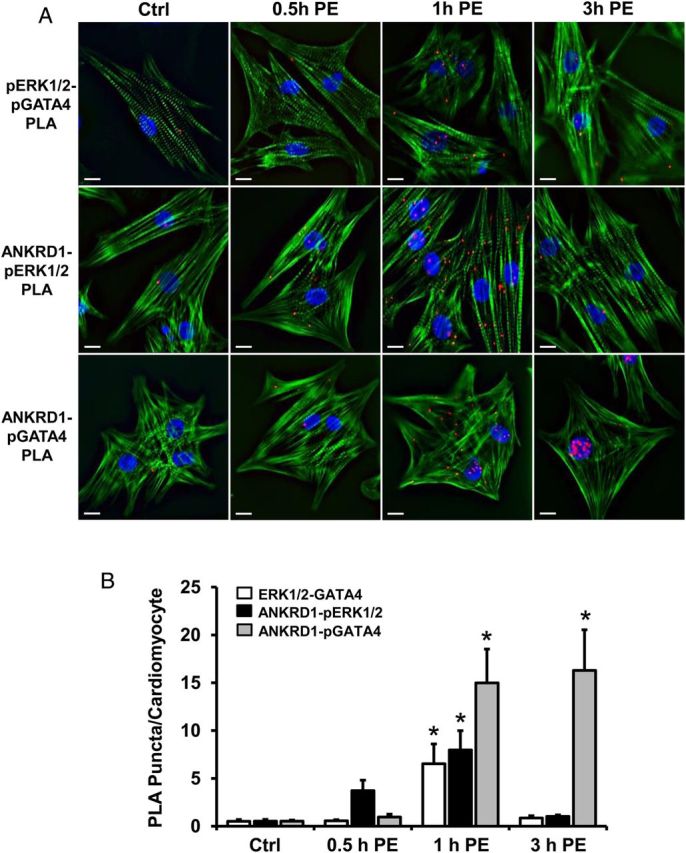
Figure 6.

Spatiotemporal interactions between ANKRD1, pERK, and pGATA4 in PE-treated NRVM. (A) Representative images of NRVM treated with 100 µM PE at various time-points, showed PLA interactions between pERK1/2 and pGATA4 (upper panel), ANKRD1 and pERK1/2 (middle panel), and ANKRD1 and pGATA4 (lower panel). NRVM were stained for filamentous actin (green) and DAPI (blue). Scale bar = 10 µm. (B) PLA interactions were quantified for each time-point by determining the number of red puncta per cardiomyocyte. A total of 40–50 myocytes were averaged per time-point. Values expressed as mean ± SEM, n = 5, *P < 0.05 vs. untreated control (Ctrl).
