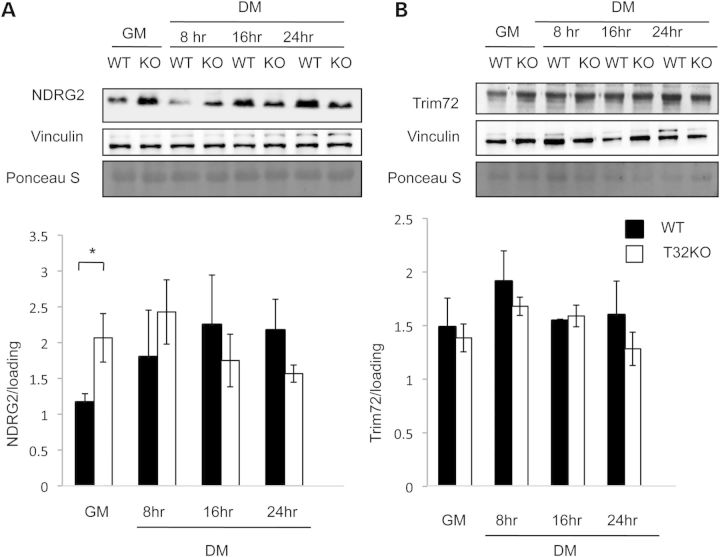
Figure 4.
NDRG2 levels increased in primary T32KO myoblasts comparing with WT cells. Western blot analysis demonstrates expression of NDRG2 (A) and Trim72 (B) proteins in primary myoblasts. Representative blots of total cell lysates are shown for each protein, in myogenic cells in GM and at different indicated times after switching to DM. Vinculin and Ponceau S stained blots are included to show the relative concentration of proteins in the cell lysates. Densitometry data were normalized to loading. Values represent the mean of at least three independent experiments ± SEM (*P < 0.05). Statistical analysis by t-test.

