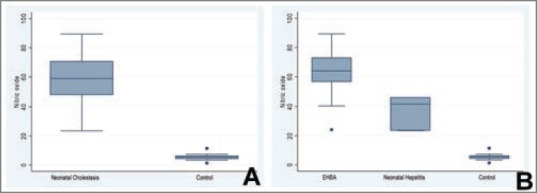
Figure 1.

(a) Graphical representation of the levels of nitric oxide (NO) (μmol/l) in patients with neonatal cholestasis (Groups I and II taken together) as compared to the control group. (b) Graphical representation of the levels of NO (μmol/l) in patients with extrahepatic biliary atresia (Group I), neonatal hepatitis (Group II) and in the control group
