
Fig. 1.
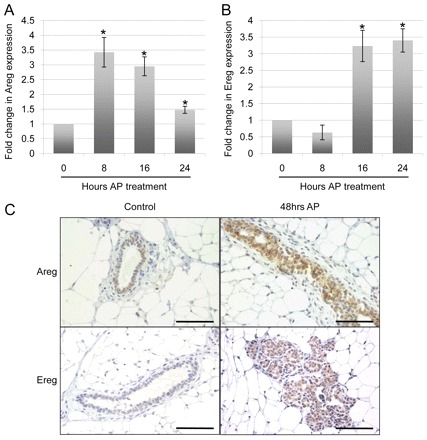
AREG and EREG are induced following FGFR1 activation in vivo. (A,B) MMTV-iFGFR1 animals were administered by intraperitoneal injections of 1 mg per kg of body weight AP for the times indicated. Following AP treatment, the animals were killed, and their fourth inguinal mammary glands were removed for either isolation of RNA or paraffin embedding and subsequent tissue analysis. An analysis of the data from previously published microarray experiments (Schwertfeger et al., 2006) demonstrates that Areg (A) and Ereg (B) were both significantly upregulated at the indicated timepoints. Error bars represent s.e.m. *P<0.05. (C) AREG and EREG detection by immunohistochemistry on mammary gland sections from either WT or MMTV-iFGFR1 mice treated with AP for 48 hours. Images are representative of at least three mice per treatment group. Scale bars: 50 μm.