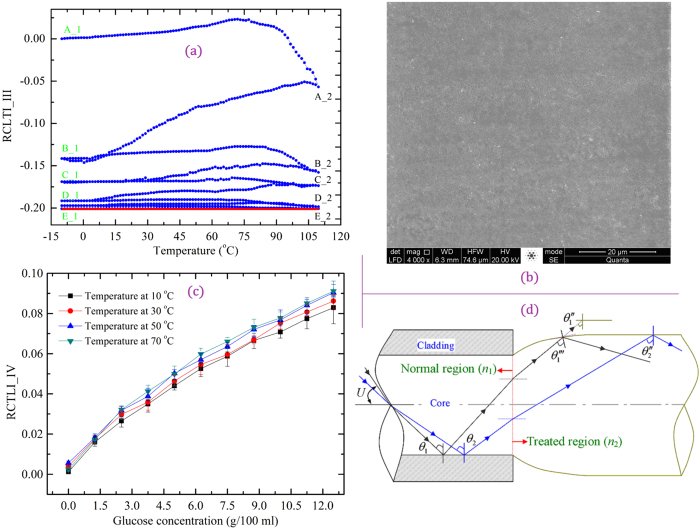
Figure 4. Change trajectory of light, surface morphology and temperature independence of the POF sensor.
(a) RCTLI_III as a function of temperature (curves A_1, B_1, C_1, D_1, and E_1 represent RCTLI_III values over the temperature range of −10 to 110 °C, and curves A_2, B_2, C_2, D_2, and E_2 represent RCTLI_III values over the range of 110 to −10 °C), (b) ESEM image (4.00 kX) of U-shaped region subjected to heating-cooling treatment, (c) RCTLI_IV as a function of glucose concentration, and (D) the propagation path of light in the heating-cooling-treated POF.

