Figure 3.

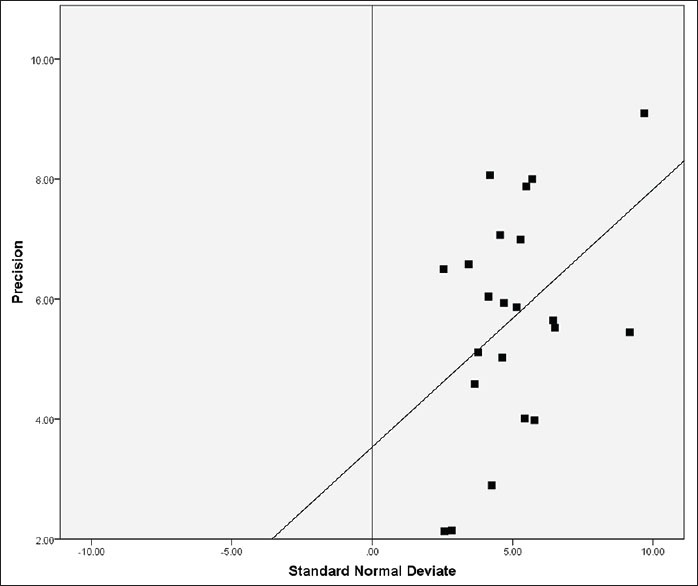
Egger's plot for assessment of publication bias. Precision was 1/(standard error of effect size). Regression line computed as: Standard normal deviate = 2.658 + 0.410 × (Precision)

Egger's plot for assessment of publication bias. Precision was 1/(standard error of effect size). Regression line computed as: Standard normal deviate = 2.658 + 0.410 × (Precision)