
Figure 4.
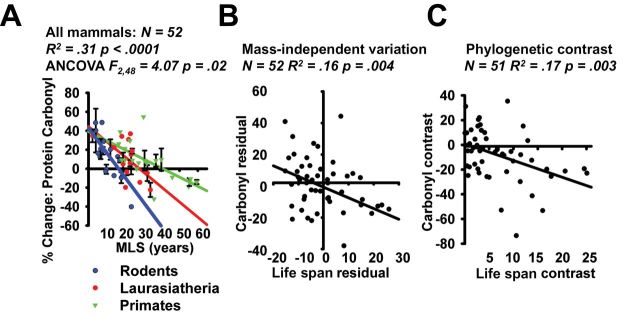
(A) Scatterplot of % change in protein carbonyl content following exposure to 100 μM H2O2 in 52 species of mammals. Values are pooled from Figures 1 and 3. Regression lines represent trends within individual clades, and the statistics represent comparisons within the group as a whole. (B) Scatterplot of mass-adjusted changes in protein carbonyl content following exposure to 100 μM H2O2 in 52 species of mammals. Values represent the residual from Supplementary Figure 3A (x-axis) & Supplementary Figure 3B (y-axis). (C) Scatterplot showing standardized contrast analysis for protein carbonyl content following exposure to 100 μM H2O2 in 52 species of mammal. Values are calculated as described in Ref. (22) and are based on the phylogeny in Supplementary Figure 4 and reference list in Supplementary Figure 5. Note: N = 51 instead of 52 due to the pairwise comparisons involved in the phylogenetic contrast.