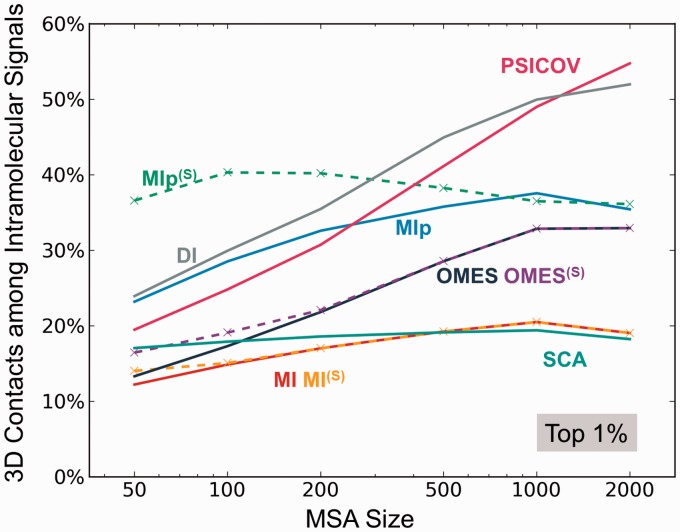
Fig. 5.
Dependence of the performance of different methods on the size of the MSA. The abscissa shows the number m of sequences included in the MSAs. The ordinate shows the percentage of 3D contact-making pairs among the most strongly coevolving (top 1%) pairs of residues predicted by different methods. PSICOV and DI show a strong dependence on m. MIp(S) is distinguished by its superior performance when the number of sequences is as low as 50. See also the results for top 0.1% and 10% covarying residues in SI, Supplementary Figure S5. The latter case further exposes the distinctive effectiveness of MIp(S) for identifying 3D contact-making pairs

