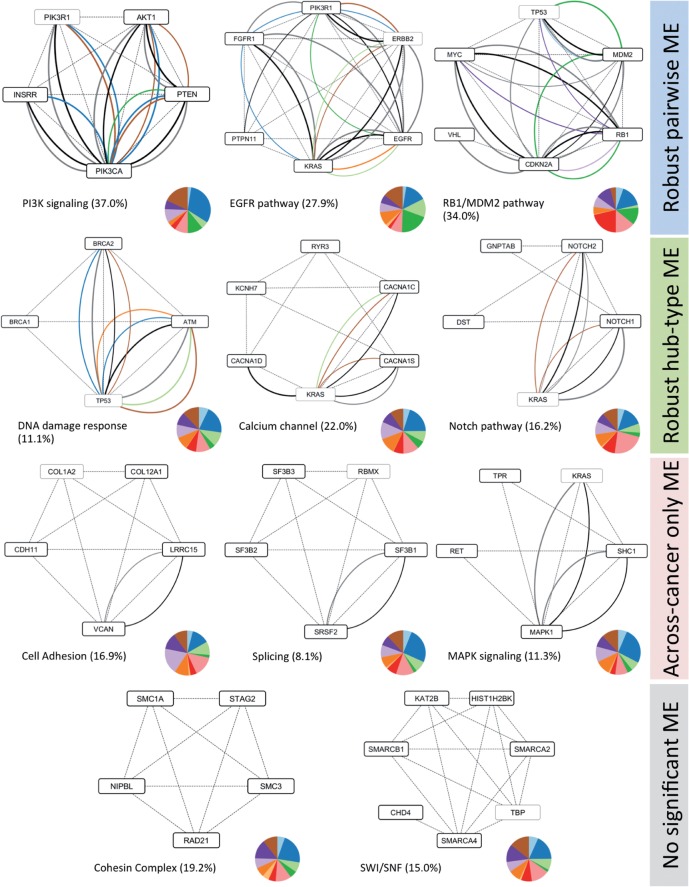
Fig. 6.
Representative modules obtained by MEMCover algorithm. Dashed lines correspond to HumanNet edges, solid lines are for WITHIN_ME colored by its tissue type using Pan-Cancer color coding (see the legend in Fig. 1). Black and gray edges represent ACROSS_ME and BETWEEN_ME, respectively. For each module, we show the percentage of samples with alterations in the module and a pie chart with the distribution of the number of samples with at least one mutation in each tissue type. For genes belonging to more than modules, they were counted according to module membership before extending them to allow overlap (therefore counted only once). Genes are not counted for the coverage and for the pie chart in a given subnetwork are marked as light gray boxes. Not pictured modules include, among others, an additional subnetwork related to SWI/SNF [PBRM1, TOX2, SMARCA4], MHC class one members [HLA, HLB], exocytosis related group [TRPC4, EXOC4, EXOC3, EXOC7, RALA]. The full list of subnetworks is provided in Supplementary Materials. The networks are created using Cytoscape (Shannon et al., 2003)

