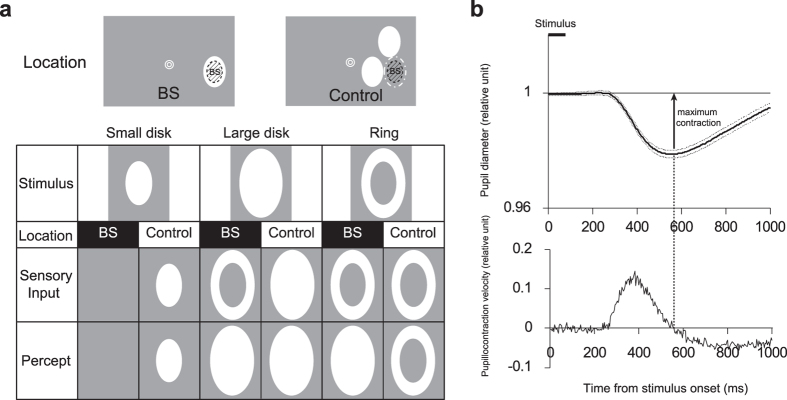
Figure 1. Stimuli schematics and a typical time course of pupillary light reflex (PLR).

(a) Stimuli schematics. The small disk, large disk, and ring were displayed either at the blind spot (BS) (test condition) or adjacent to the BS (control condition). The shaded regions in the insets indicate the BS. If the area of stimulated photoreceptors determines the PLR magnitude, the large disk presented outside the BS (i.e., in the control condition) is expected to induce the greatest PLR. If the perceived area determines the PLR, the large disk and ring presented at the BS (test condition) and the large disk presented outside the BS (control condition) should all induce equally large PLR. (b) Typical time course of pupil diameter (upper panel) and its velocity (lower panel) measured in the present study. In each trial, the pupil diameter was normalized to the average diameter in the 500 ms prior to stimulus onset. The average pupil diameter change from the baseline ± 100 ms around the time of the maximum contraction was considered the PLR size (relative units) for each trial.
