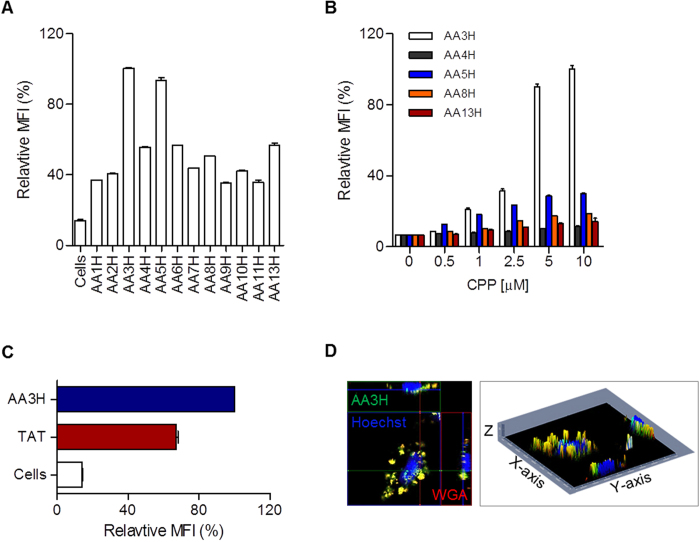
Figure 2. Cellular uptake of CPP candidates derived from annexin isoforms.
(A) Mean fluorescence intensity (MFI) of the cells treated with fluorescently labeled CPP candidates (1 μM) was determined relative to the highest intensity with AA3H. (B) Dose-dependent uptake efficiency of the selected five CPP candidates such as AA3H (white bars), AA4H (gray bars), AA5H (blue bars), AA8H (orange bars), and AA13H (red bars) determined at various concentrations (0, 0.5, 1, 2.5, 5, and 10 μM). (C) Comparison of cellular uptake efficiency between AA3H and TAT. In all cytometric analysis, each bar represents the average of three independent experiments. (D) An ortho-view of z-stack images of a cell to confirm intracellular delivery of AA3H. The horizontally sectioned side view by the green line and the vertically sectioned side view by the red line were displayed at the top and the right regions, respectively, in the fluorescence microscopic image (left). Plasma membrane and nucleus were visualized by staining with Alexa Fluor 594-conjugated wheat germ agglutinin (WGA) (red) and a Hoechst dye (blue). A z-stacked image indicates clearly intracellular delivery of AA3H as observed either in the cytoplasm (green color) or in the plasma membrane (yellow color due to superimposition with the red color, right).

