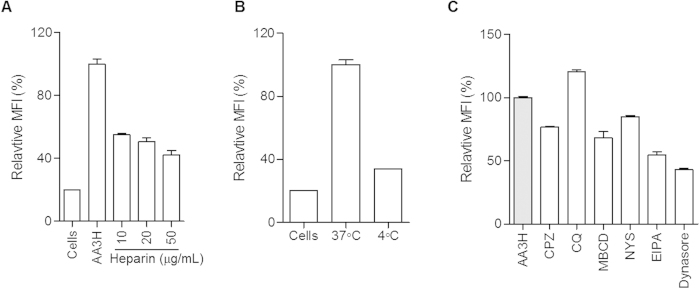
Figure 3. Cellular internalization mechanisms of AA3H.
(A) Influence of heparin on intracellular delivery of AA3H analyzed using a flow cytometer. Each bar represents the average of three independent experiments and expressed as a percentage value relative to the delivery level of AA3H in the absence of heparin. (B) Energy dependent penetration of AA3H. The relative penetration efficiency at the lowered temperature (4 °C, middle) was compared with that at 37 °C (right) (C) Delivery of AA3H into the cells pre-treated with endocytosis inhibitors. The delivery level of AA3H into untreated cells was used as the control and displayed as the gray bar. Each bar represents the average of three independent experiments.

