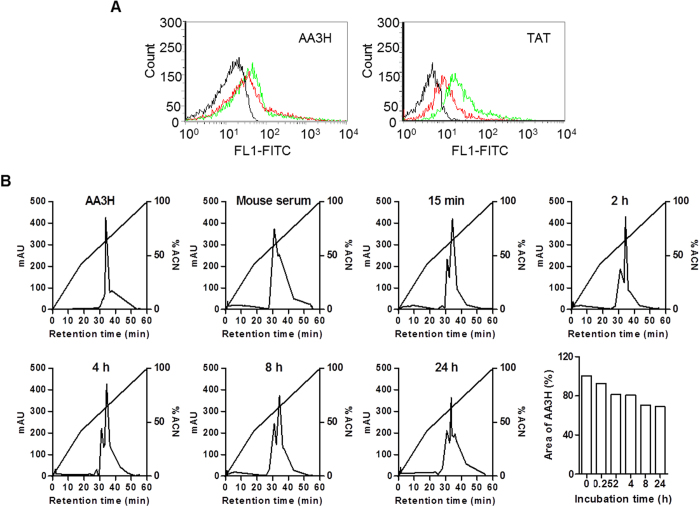
Figure 6. Serum stability of AA3H.
(A) The HeLa cells treated with AA3H (left) or TAT (right) peptides (1 μM) in the presence (red trace) or absence (green trace) of 10% mouse serum were analyzed by a flow cytometer. The black profile indicates the untreated control cells. (B) AA3H was incubated with 10% mouse serum for several time points (0, 15 min, 2, 4, 8, 24 h) at 37 °C. The AA3H peak was appeared at 34.26 min and the peak of serum was 31.01 min. The relative peak area (%) of AA3H at each time point was calculated based on the initial peak area and displayed in a bar chart (right bottom).

