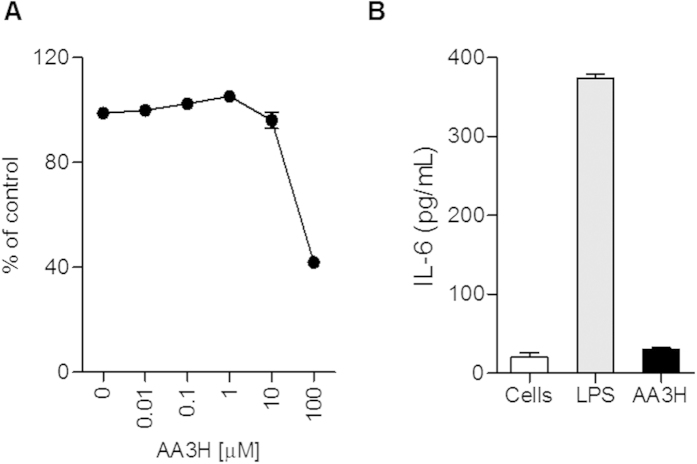
Figure 7. Toxicity and immunogenicity test for AA3H.
(A) Cell viability 24 h after treatment of AA3H peptide at varying concentrations (0, 0.01, 0.1, 1, 10, 100 μM). Each point represents the average of four independent experiments. (B) The level of IL-6 released from Raw 264.7 cells was determined after treatment of AA3H (10 μM, black bar) or LPS (10 μg/mL, gray bar). The level from untreated cells is displayed with a white bar. Each bar represents the average of three independent experiments.

