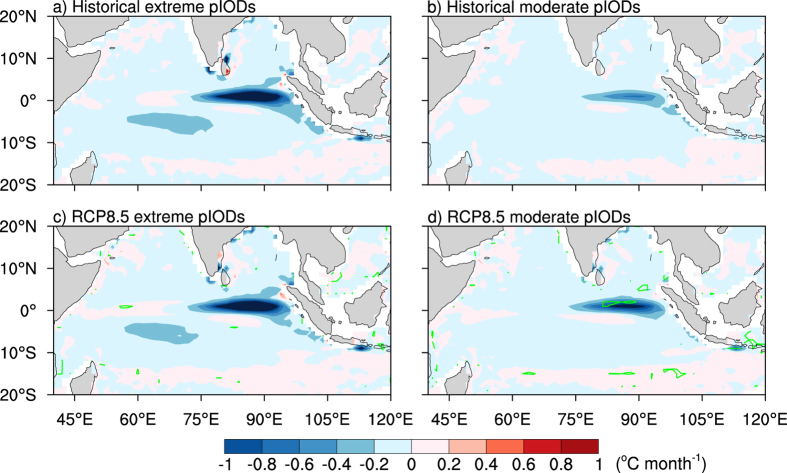
Figure 4. Nonlinear vertical advection during extreme and moderate pIOD events.
(a) Map showing the multi-model ensemble mean historical SON nonlinear vertical advection term during extreme pIODs. (b) As in (a) but for moderate pIODs. (c), (d) As in (a), (b) respectively but for the RCP8.5 period. The green contours in (c) and (d) denote where the difference between the historical and RCP8.5 periods is significant at the 95% confidence level. The significance is calculated using a two-tailed Student’s t-test. All maps were generated in NCL.

