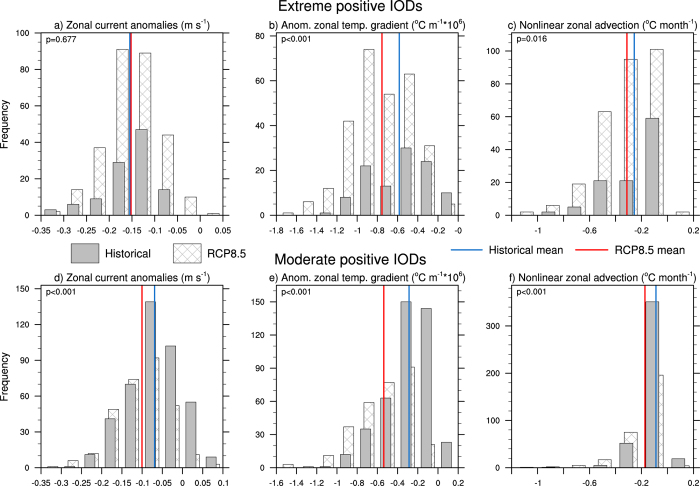
Figure 5. Multi-model statistics for nonlinear zonal advection and its terms.
(a) Multi-model ensemble histogram of SON zonal current anomalies associated with extreme pIODs in the equatorial IO (60°E-100°E, 5°S-5°N). (b), (c) As in (a) but for the anomalous zonal temperature gradient and nonlinear zonal advection respectively. (d), (e), (f) As in (a), (b), (c) but for moderate pIODs. The solid (hatched) bars represent the historical (RCP8.5) anomalies and the solid blue (red) lines represent the historical (RCP8.5) mean values. The p-values from a two-tailed Student’s t-test are shown in the top left hand corner of each histogram. All plots were generated in NCL.

