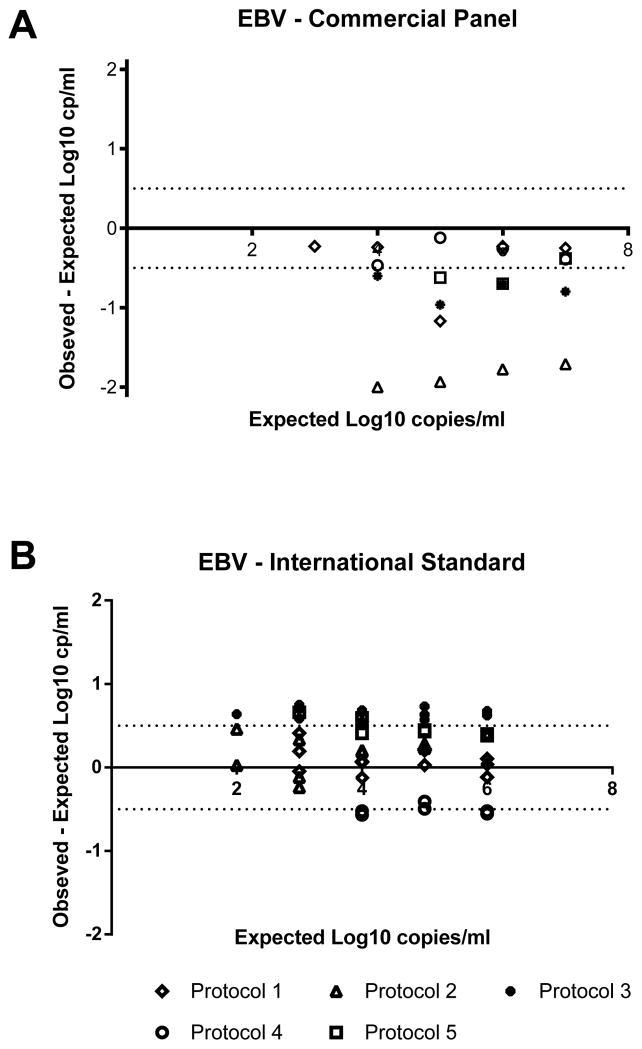
Figure 2. Accuracy of EBV viral loads.
Each point represents an individual replicate from the protocol as indicated in the legend. Negative results and viral load values below the reportable range of the assay for each protocol are not included. The horizontal dotted lines correspond to the acceptable range of variation of ±0.5 log10 copies/ml from 0.

