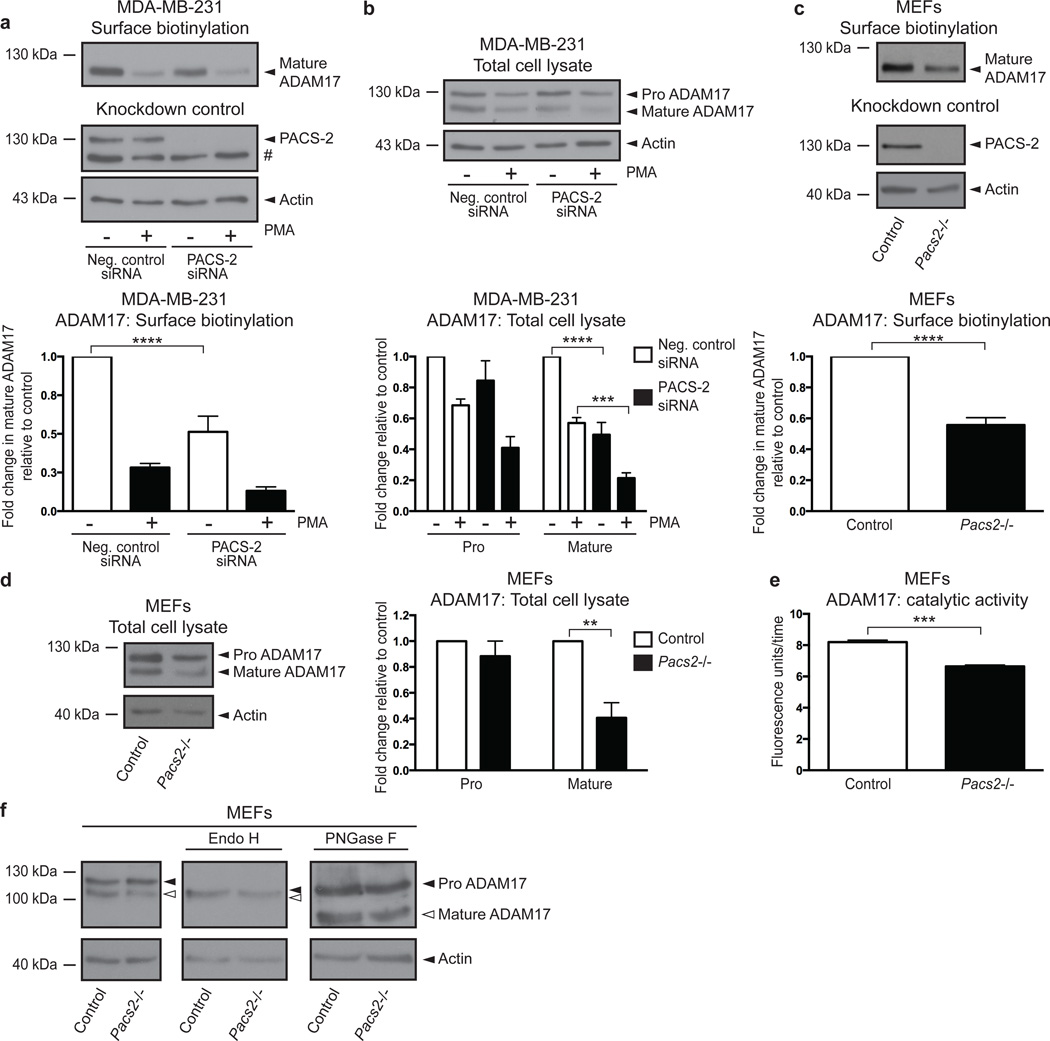
Fig. 3. PACS-2 regulates cell-surface availability of mature ADAM17.
(a+b) MDA-MB-231 cells were siRNA-transfected and PMA-stimulated. Cells were surface biotinylated and analysed by western blot. ADAM17 levels were normalized to input actin and fold changes were calculated by setting the unstimulated negative control for each experiment to 1, then normalizing the other raw data to this value, and finally calculating the average of all individual experiments. Cell-surface levels of mature ADAM17 (a) and total cellular levels of pro and mature ADAM17 (b) are shown with data compiled from 4 individual experiments. (c+d) Unstimulated cell-surface levels of mature ADAM17 (c) and total cellular levels of pro and mature ADAM17 (d) in control and Pacs2−/− MEFs were analysed as in (a+b). Data were compiled from 4 individual experiments in (c) and 3 individual experiments in (d). (e) ADAM17 was immunoprecipitated from unstimulated control and Pacs2−/− MEFs and its activity assessed using an ADAM17 quenched fluorescence peptide substrate. The graph shows the average gradient (fluorescence units/time) of the linear regressions describing enzymatic activity. The data were compiled from 3 individual experiments, each performed in triplicate. (f) Lysates from control and Pacs2−/− MEFs were treated with EndoH or PNGase F and the effects on ADAM17 examined by western blot. The images shown are derived from the same blot but different exposures (indicated by separate panels). The blot shown is representative of 3 individual experiments. On blots, # denotes a non-specific band. Graphs show mean values ± SEM. Data were analysed by ANOVA or unpaired two-tailed Student’s t-test, as appropriate. **p<0.01, ***p<0.001, ****p<0.0001.

