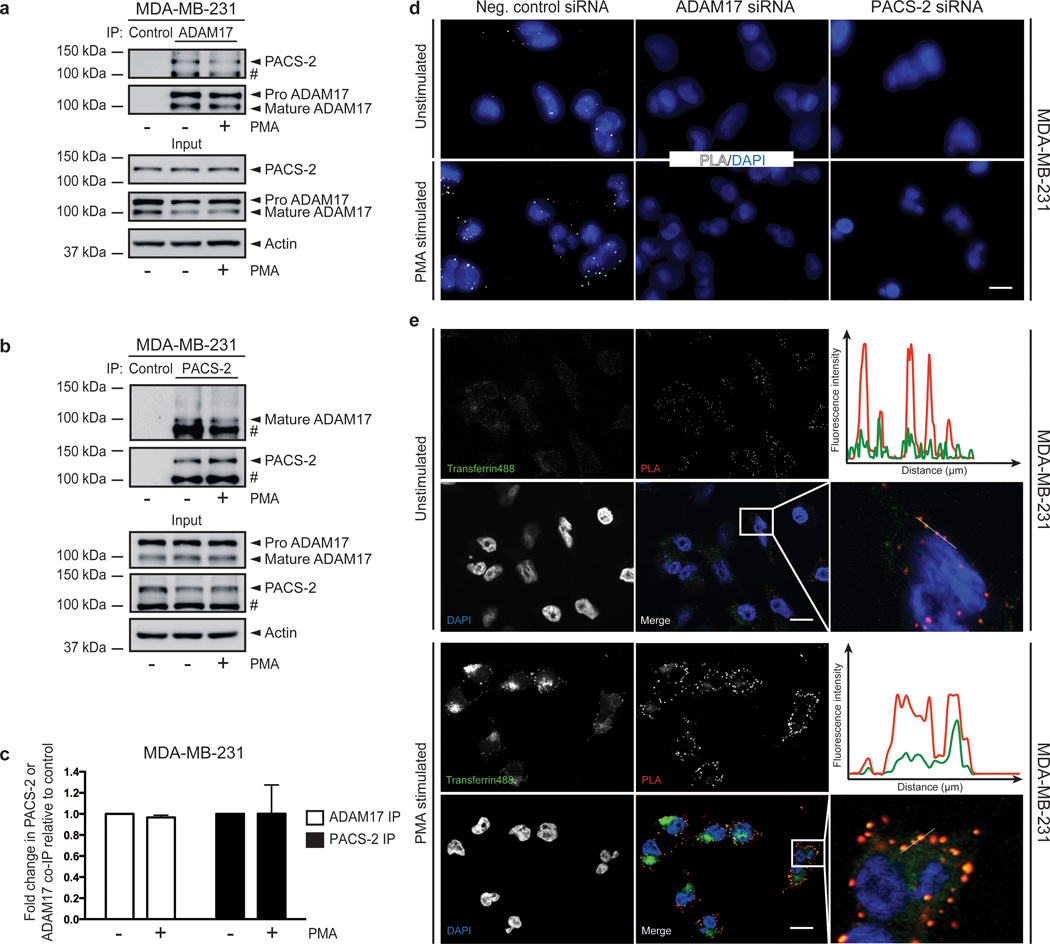
Fig. 4. PACS-2 interacts with ADAM17 in endocytic compartments.
(a-b) ADAM17 (a) or PACS-2 (b) was immunoprecipitated (IP) from unstimulated and PMA-stimulated MDA-MB-231 cells (b), and co-immunoprecipitation (co-IP) of PACS-2 (a) or ADAM17 (b) detected by western blot. The blots shown are representative of three individual experiments and # denotes a non-specific band. (c) The effect of PMA stimulation on PACS-2/ADAM17 co-immunoprecipitation in (a) and (b) was quantified. The amount of co-immunoprecipitated PACS-2 (a) or mature ADAM17 (b) was normalized to the amount of immunoprecipitated mature ADAM17 (a) or PACS-2 (b). The unstimulated negative control for each experiment was then set to 1, the other raw data were normalized to this value, and finally the average of all individual experiments was calculated. Data were analysed by unpaired two-tailed Student’s t-test. (d) MDA-MB-231 cells were transfected with siRNA and subjected to Proximity Ligation Assay (PLA) with or without PMA stimulation. The experiment was performed 10 times in duplicate. Two experiments included the knockdown controls. Scale bar represents 7 µm. (e) Before PLA, MDA-MB-231 cells were left unstimulated or treated with PMA and subsequently allowed to internalize fluorescent transferrin for 5 minutes. Scale bar represents 14 µm. Fluorescence intensities were quantified along the lines on the enlarged images and depicted on the graphs. The experiment was performed 4 times in duplicate.

