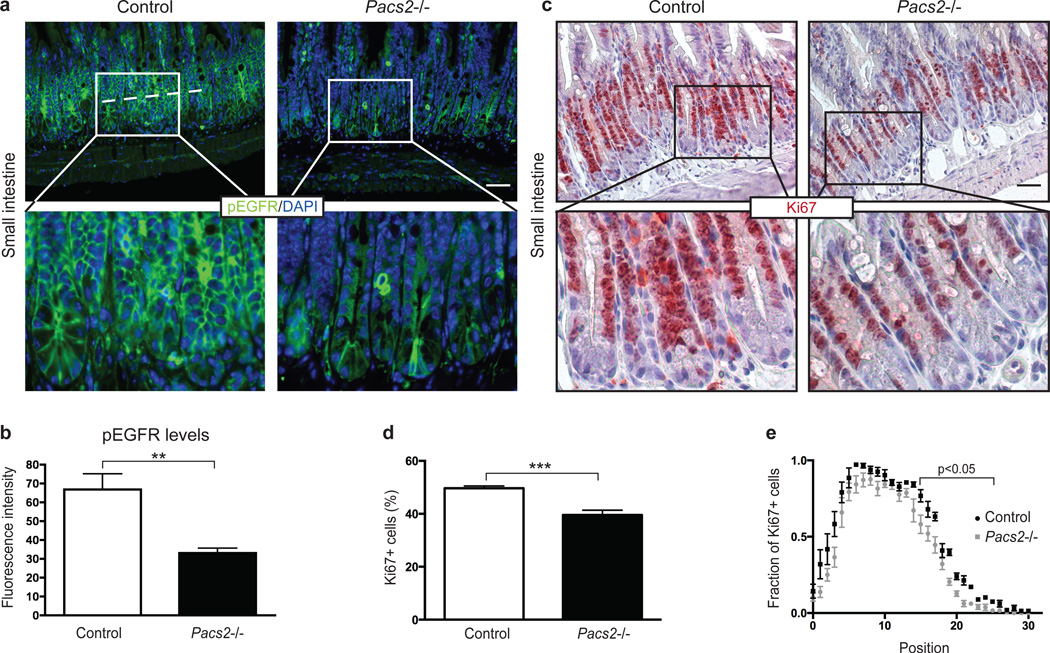
Fig. 6. PACS-2 controls EGFR activity in vivo.
(a) Immunohistochemistry for EGFR pY1068 and nuclear DAPI stain were performed on sections from the small intestine of 5 wildtype and 7 Pacs2−/− mice. The scale bar represents 43 µm. (b) For each section, four images were taken at corresponding random points and the fluorescence intensity of pEGFR quantified along a line averaging 193 µm across small intestinal crypts, represented by the dotted line in (a). (c) Immunohistochemistry for Ki67 on sections from the small intestine of 5 control and 6 Pacs2−/− mice. The scale bar represents 52 µm. (d) The percentage of Ki67 positive cells was quantified. For each mouse, over 900 crypt cells were scored, unless not enough well oriented crypts were available. (e) The position of Ki67 positive cells in small intestinal crypts was scored from crypt cell position 0 (bottom) to 30 (top) and the number represented as a fraction out of the total number of cells counted for each position. Graphs show mean values ± SEM. Data were analysed by unpaired two-tailed Student’s t-test. **p<0.01, ***p<0.001.

