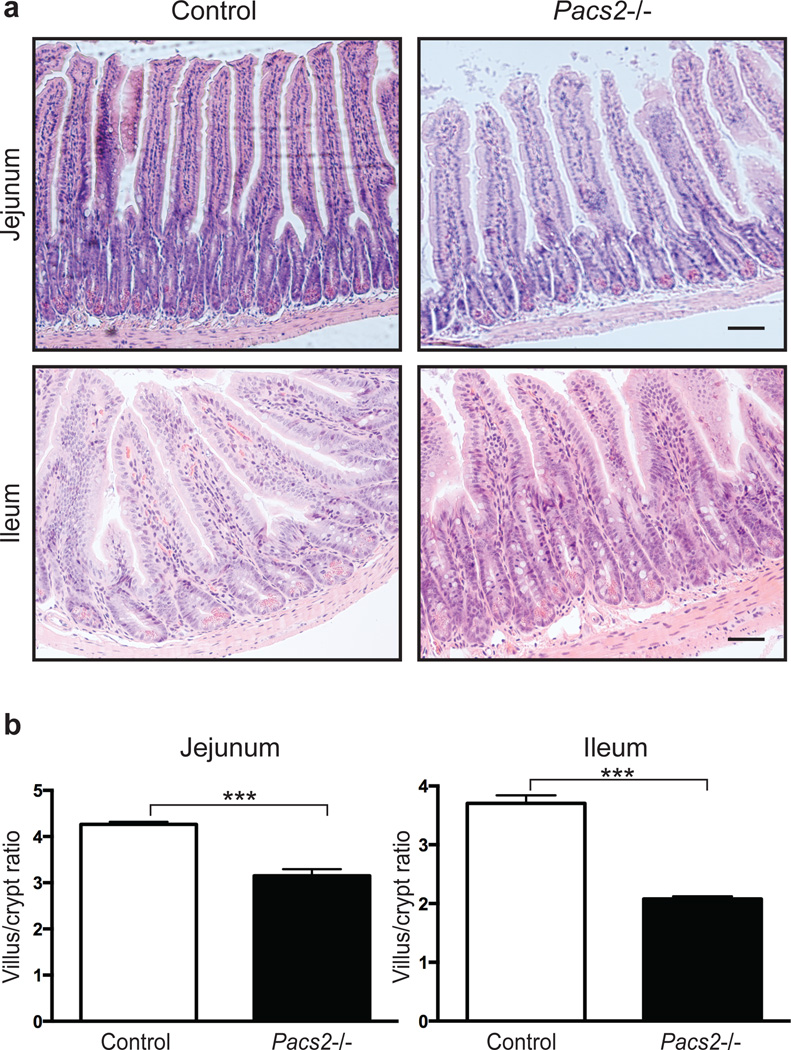
Fig. 7. PACS-2 regulates intestinal tissue homeostasis.
(a) Histology of the small intestine of Pacs2−/− mice. Scale bars represent 63 µm. (b) The ratio of villus height to crypt depth in jejunum and ileum was quantified using 4 control and 4 Pacs2−/− mice. More than 100 villi were assessed for each genotype and segment. Graphs show mean values ± SEM. Data were analysed by unpaired two-tailed Student’s t-test. ***p<0.001.

