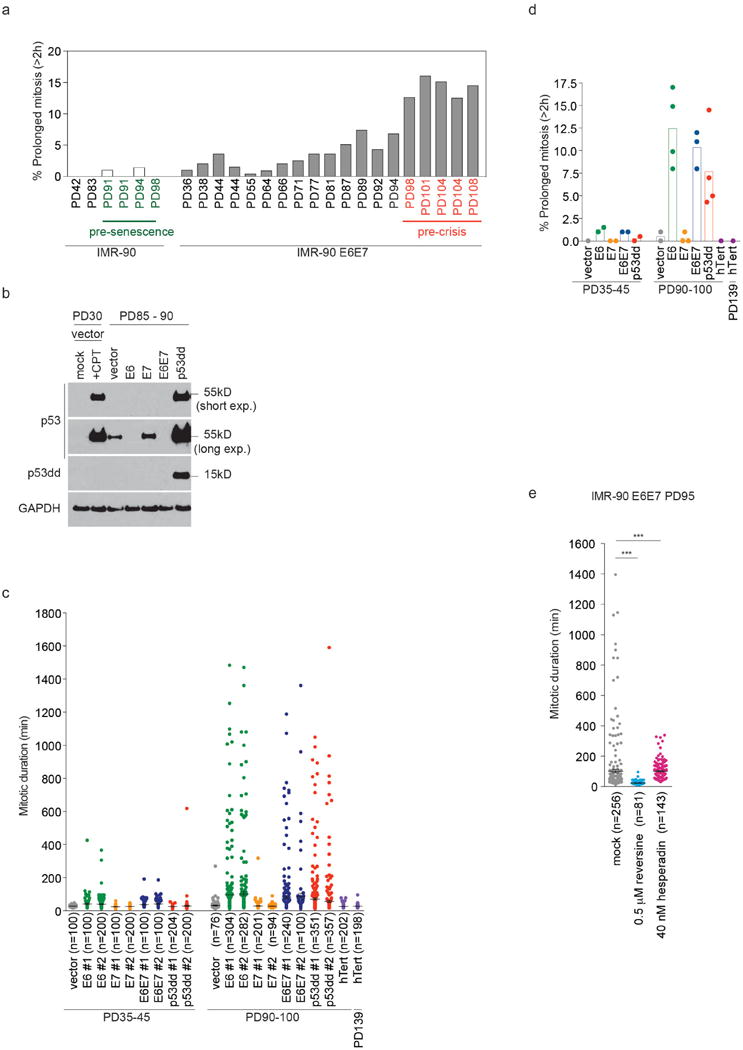
Extended Data Figure 1.

a, Percentage of cells that spend more than 2 h in mitosis (prolonged mitosis), shown in Fig. 1b. b, Effect of indicated oncogenes on p53 expression. c, Scatter plots show mean mitotic duration ± s.e.m. of individual IMR-90 derivative cells analyzed in Fig. 1d. d, Scatter plots with bars show mean percentage of prolonged mitosis analyzed in Fig. 1d (1 – 4 independent experiments). e, Scatter plots show mean mitotic duration of IMR-90 E6E7 PD95 cells exposed to reversine and hesperadin ± s.e.m. (***P<0.0001, Mann-Whitney test). The result was reproduced in two independent experiments.
