
Extended Data Figure 4.
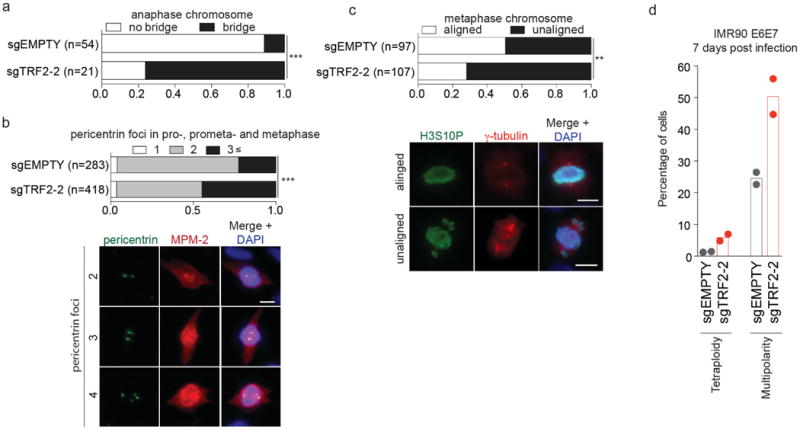
Ratio of anaphase chromosome with or without anaphase bridge (a), pericentrin foci in pro-, prometa- and metaphase (b) and metaphase chromosome with or without unaligned chromosome (c) in IMR-90 E6E7 expressing sgEMPTY and sgTRF2-2 7 days after infection (Fisher's exact test, for pericentrin foci, 1 and 2 foci vs ≥3 foci). Representative images from sgEMPTY cells are shown below (b, c). Results were reproduced in two independent experiments. d, Scatter plots with bars show mean percentage of cells that posses tetraploidy (FACS analysis) and multipolarity (≥3 pericentrin foci as in (j)) in IMR-90 E6E7 cells expressing sgEMPTY and sgTRF2-2 7 d after infection (two independent experiments). **P<0.005, ***P<0.0001. Fisher's exact test. Scale bar, 10 µm.