
Extended Data Figure 7.
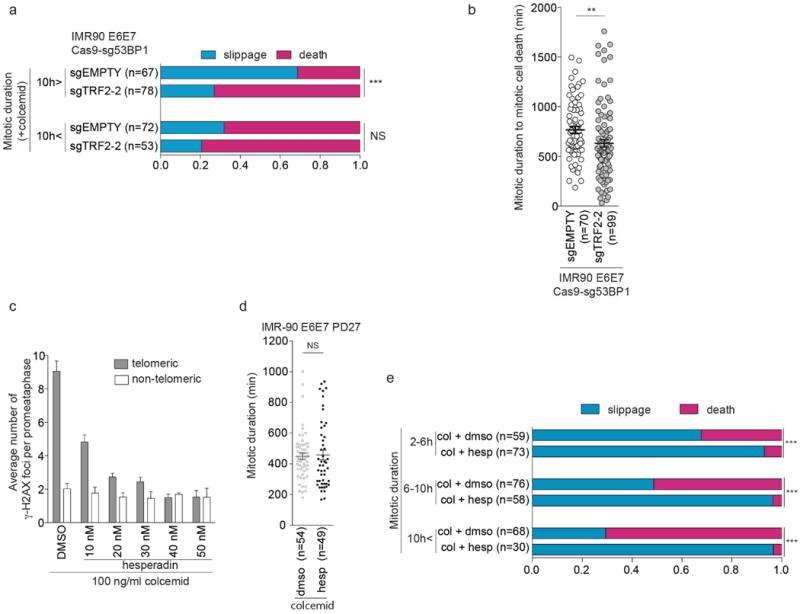
a, Ratio of mitotic slippage and cell death in IMR-90 E6E7 Cas9-sg53BP1 cells expressing sgEMPTY and sgTRF2-2 in the presence of colcemid, analyzed as in Fig. 3f (Fisher's exact test, death vs slippage). b, Scatter plots show mean mitotic duration ± s.e.m. prior to cell death of individual IMR-90 E6E7 Cas9-sg53BP1 cells expressing sgEMPTY and sgTRF2-2 in the presence of colcemid (Mann-Whitney test). c, Bars show mean of three independent experiments of average telomeric and non-telomeric γ-H2AX foci ± s.d. in IMR-90 E6E7 cells at PD45 exposed to colcemid in the presence of DMSO or hesperadin at indicated concentrations for 24 h analyzed as in Fig. 4d (50 metaphase per experiment). For one-way ANOVA telomeric foci, P<0.0001; non-telomeric foci, not significant. d, Scatter plots show mean mitotic duration ± s.e.m. of IMR-90 E6E7 cells at PD27 exposed to 100 ng/ml colcemid in the presence of DMSO or 40 nM hesperadin ± s.e.m. (Mann-Whitney test). e, Ratio of mitotic cell fate in IMR-90 E6E7 cells around PD45 exposed to 100 ng/ml colcemid in the presence of DMSO or 40 ng/ml hesperadin (Fisher's exact test, death versus slippage). **P<0.005, ***P<0.0001. NS, not significant.