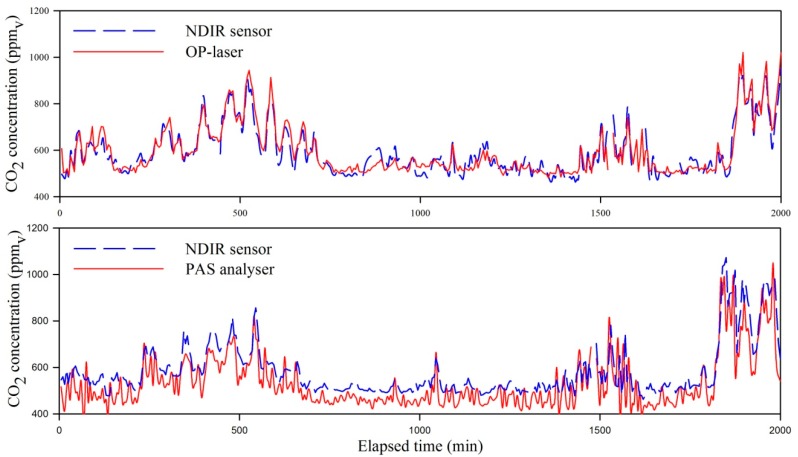
Figure 7.
Snapshot of CO2 concentrations in the dairy cow barn monitored with NDIR sensors, when compared with the OP-laser while used to measure the mean concentration in an open-path of 64 m in the cow barn with five sensors and the (top) and compared with the PAS analyzer on a single-point basis (bottom). The top and bottom plots are from data collected in a simultaneous trial.

