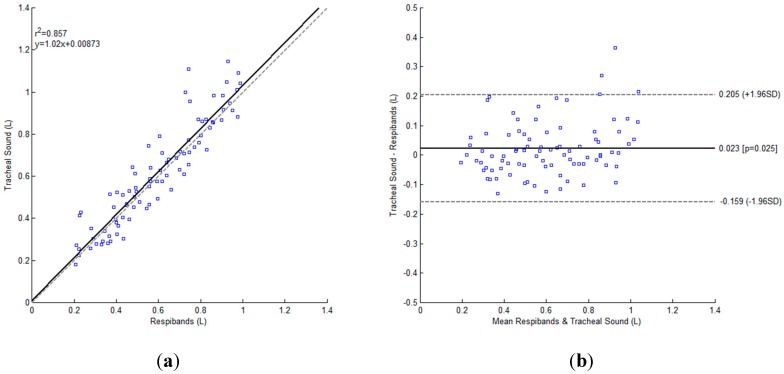
Figure 8.
Bland-Altman plot for BFD feature with the exponential model, for expiratory phase, while the participants (N = 5) were breathing without a tube during the first day of experiments. (a) The regression plot: The unitary line is shown as gray dashed line, while the regression line is represented as black solid line; (b) Bland-Altman plot: The bias is represented as a solid black line and the 95% limits of agreement as gray dashed lines.

