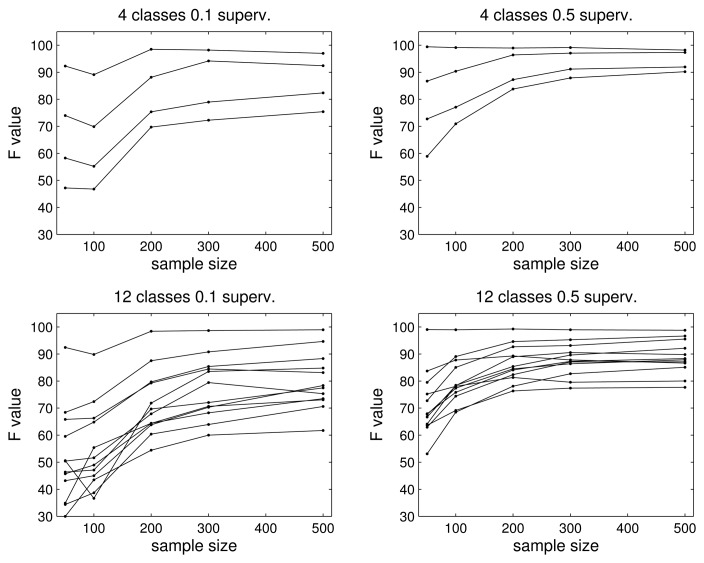
Figure 6.
Influence of data size and supervision. (Top) Four-class problem; (top-left) mean F value for the four classes vs. the number of samples per class for a 10% supervision ratio; (top-right) results with 50% of supervision; (Bottom) 12-class problem; (bottom-left) mean F value for the 12 classes for a 10% supervision ratio; (bottom-right) results with 50% supervision.

