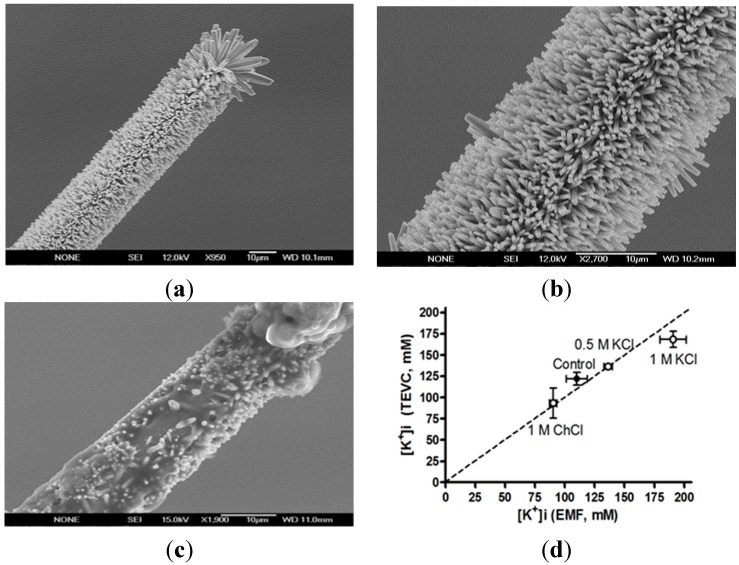
Figure 12.
Intracellular K+ concentrations in Kv channel-expressing Xenopusoocytes measured with electrophysiological and K+-selective microelectrode methods. The Field emission scanning electron microscopy images of the K+-selective microelectrode before (a,b) and after intracellular measurements (c). Data points are expressed as mean values for control oocytes and oocytes injected with 50 nL of indicated test solution (d). Error bars show SE. n = 3–5) [26].

