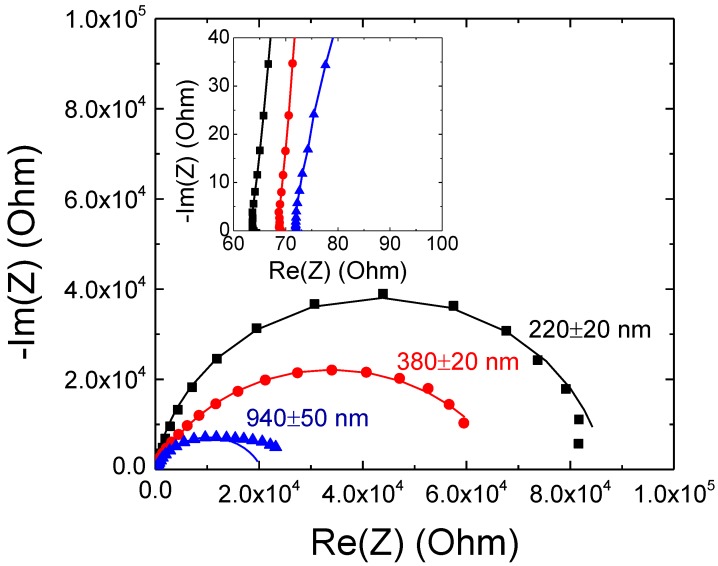
Figure 3.
Nyquist plot (recorded at −0.5 V vs. ref.) of nanoporous SnO2/ITO electrodes with increasing film thicknesses from 220 ± 20 to 940 ± 50 nm. The filled symbols correspond to experimental data and the continuous lines to fitting data. The inset shows a zoom-in of the impedance curves at high frequency region.

