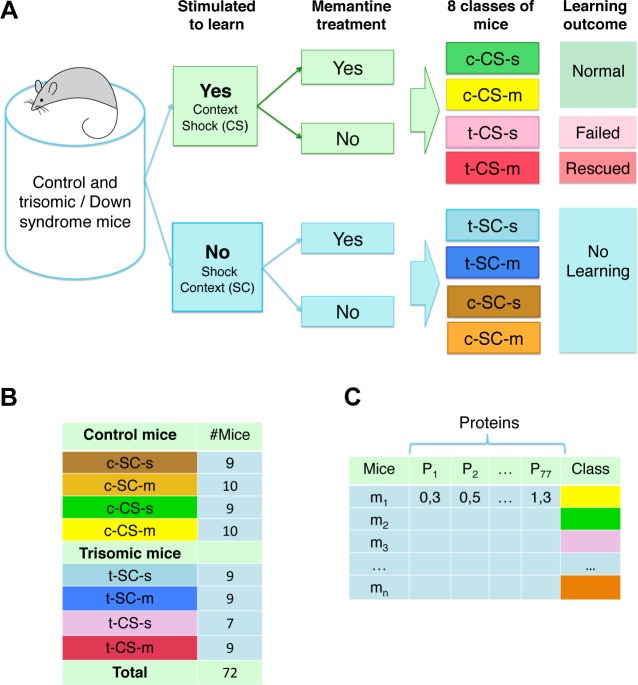
Fig 1. Classes of mice.
(A) There are eight classes of mice based on genotype (control, c, and trisomy, t), stimulation to learn (Context-Shock, CS, and Shock-Context, SC) and treatment (saline, s, and memantine, m). Learning outcome indicates the response to learning for each class. (B) Number of mice in each class. (C) Format of protein expression data: rows are individual mice, and columns, P 1 … P77, are the measured levels of the 77 proteins. The color coding in the last column identifies each class; color coding was used in visualization of the SOMs but not in clustering.

