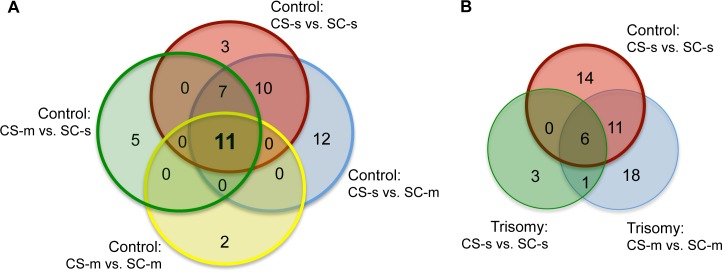
Fig 3. Venn diagrams of discriminating proteins.
(A) Intersection of proteins discriminating learning in control mice. Colors indicate the proteins that respond in the four comparisons that reflect successful learning. (B) Intersection of proteins discriminating between normal, failed and rescued learning. Red circle: number of discriminant proteins between CS-s and SC-s in control (Normal learning; repeated from panel A). Blue circle: number of proteins that respond when learning is rescued in trisomic mice with memantine (CS-m vs. SC-m). Green circle: number of discriminant proteins in comparison CS-s vs. SC-s in trisomy (Failed learning).

