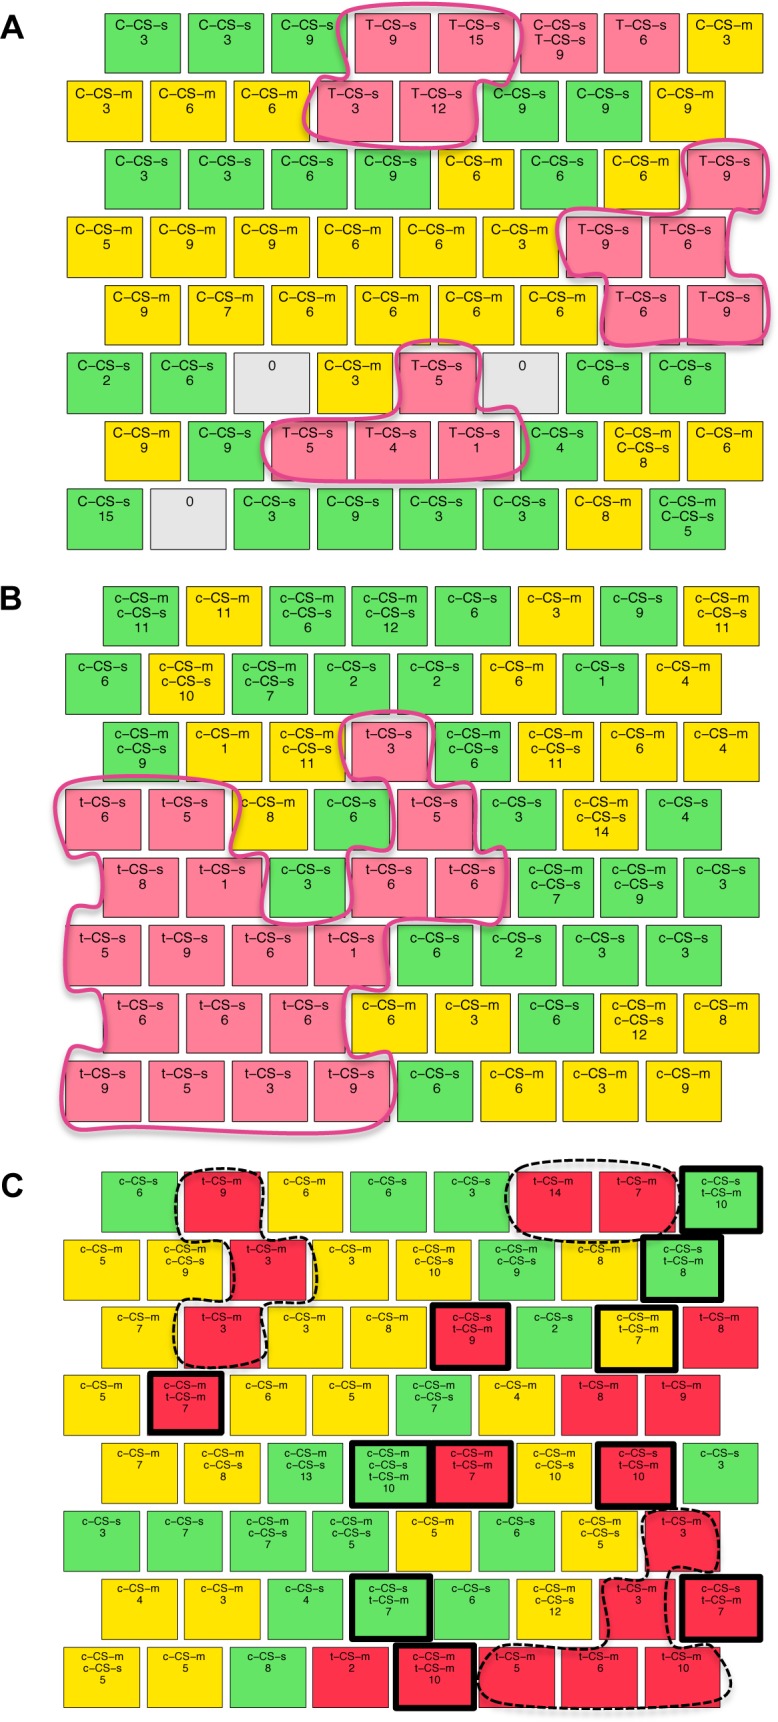
Fig 8. SOM clustering of CS classes of control and trisomic mice.

(A) t-CS-s (failed learning, light pink nodes), c-CS-s (green) and c-CS-m (yellow), using as input the levels of all 77 proteins. Pink: clusters of t-CS-s. (B) t-CS-s, c-CS-s and c-CS-m using as input only the 10 proteins that discriminate t-CS-s from both c-CS-s and c-CS-m. Pink: clusters of t-CS-s. (C) t-CS-m (rescued learning, dark pink nodes), c-CS-s and c-CS-m using as input only the set of 10 proteins that discriminate t-CS-s from both c-CS-s and c-CS-m. Dashed black line: clusters of t-CS-m mice. Black squares: nodes with mixed classes of t-CS-m and controls.
