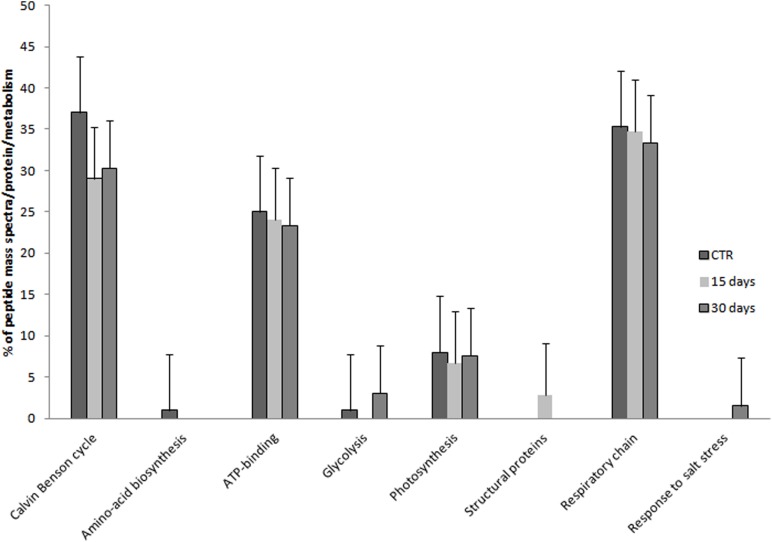
FIGURE 5.
Expression level of proteins associated as functional groups in C. nodosa leaves under normal or under hypersaline condition for 15 and 30 days. Plants after 7 days acclimation in normal condition are referred as the control samples. Values are the cumulative percentages of tandem mass spectra assigned to each protein belonging to each metabolic category performed using the spectral counting method. Mean values (±SE) are calculated among three biological replicates each treatments. See the Supplementary Table S2 for details.

