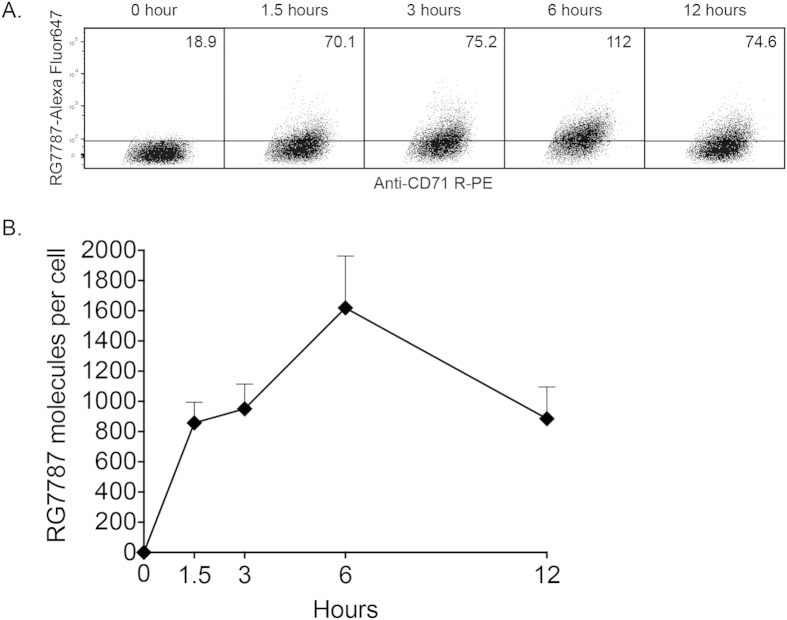
Figure 2. Quantification of RG7787 molecules per tumor cell.
A. Representative dot plots of KLM-1 xenografts (120-140 mm3) excised after treatment with 2.5 mg/kg i.v. RG7787-Alexa Fluor 647. Line is drawn above untreated tumor. The number in the top right corner of each frame is the MFI of Alexa Fluor 647 for KLM-1 (Sytox negative, CD71 R-PE positive). B. MFI values translated into average RG7787-Alexa Fluor 647 molecules per cell at each time point.

