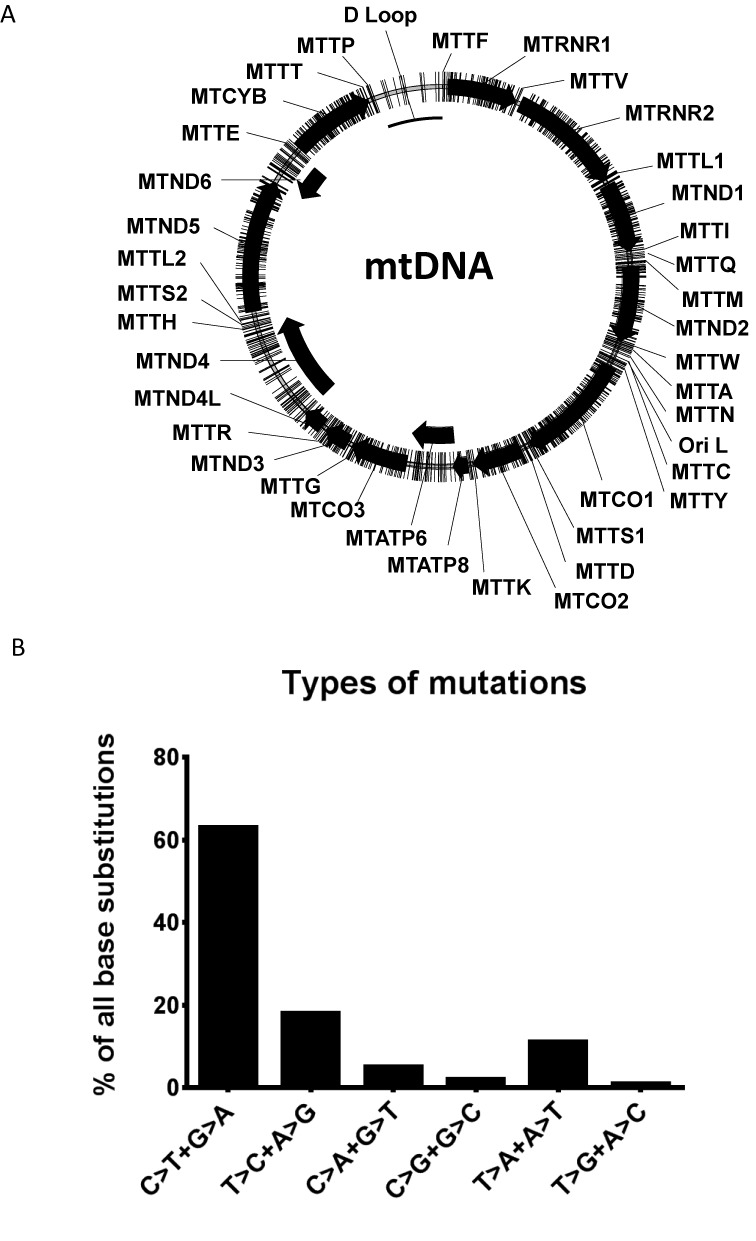
Figure 2.

Characteristics of mtDNA mutagenesis with PolG exo-. (A) Mapping of all detected mutations of mouse mtDNA. Mutations are designated as lines crossing the contour of the circular mtDNA molecule. The polypeptide-encoding genes are designated as black arrows. (B) Frequencies of various types of mutations induced by PolG exo- in mouse mtDNA. Since it is impossible to determine on which DNA strand a mutation occurred, complementary mutations are grouped (e.g. C>T transition on the Heavy strand is equivalent to G>A transition on the Light strand. Therefore C>T and G>A transitions are grouped together).
