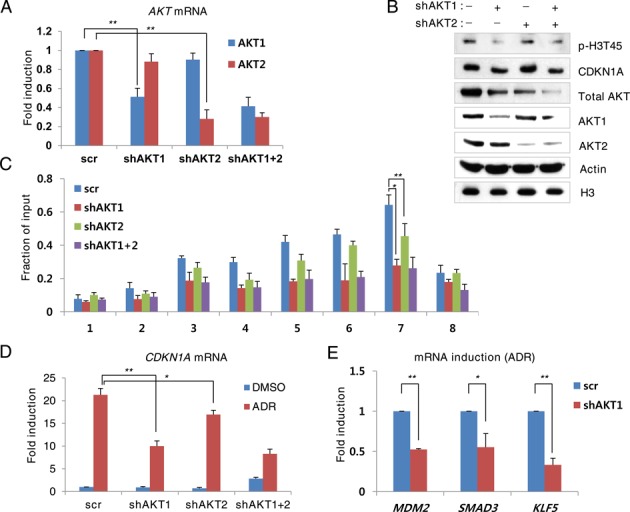
Figure 4.

AKT1 phosphorylates H3-T45 phosphorylation more efficiently than AKT2. AKT knockdown MCF10A cells were treated with 0.4 μg/ml ADR for 18 h. (A) Real-time PCR analysis of AKT mRNA. (B) Western blot analysis of total cell extracts with the indicated antibodies. (C) Phosphorylated H3-T45 ChIP assay of the CDKN1A locus. (D) Real-time PCR analysis of CDKN1A mRNA. (E) Real-time qPCR analysis of the indicated genes in ADR-treated MCF10A cells. Real-time qPCR and ChIP assay data shown are the average values of at least three independent experiments. Standard deviations are indicated as error bars. *P < 0.05, **P < 0.001.
