
Figure 2.
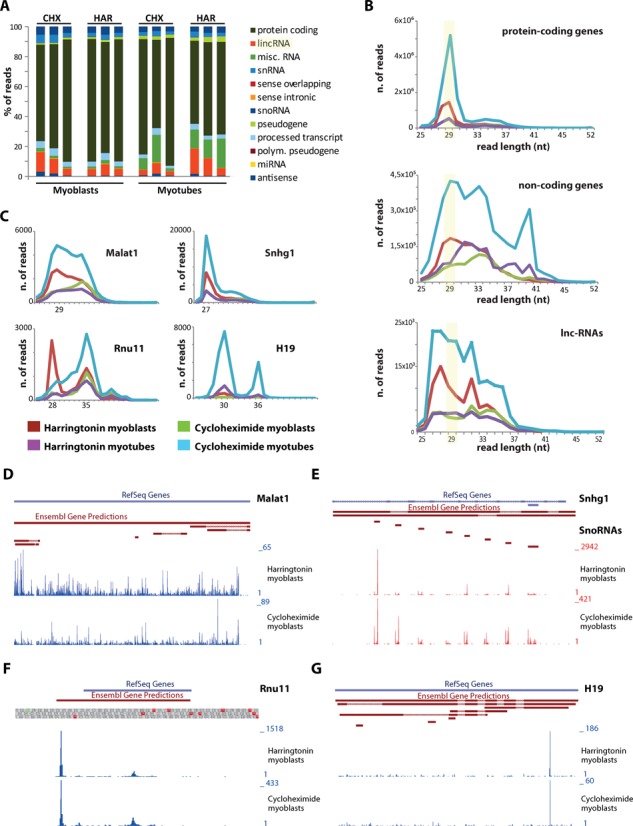
(A) Percentage of reads mapped to coding and non-coding genes in myoblasts and myotubes treated with harringtoning (Har) or cycloheximide (Chx). (B) Read-length distribution of footprints mapping to protein-coding genes (top), non-coding genes (including small and long non-coding genes) or only to lincRNAs (bottom). (C) Read-length distribution of footprints mapping to Malat1, Snhg1, Rnu11 and H19. (D–G) Coverage patterns for Malat1, Snhg1, Rnu11 and H19 in harringtonin (top traces) and cycloheximide (bottom traces) treated myoblasts.