
Figure 5.
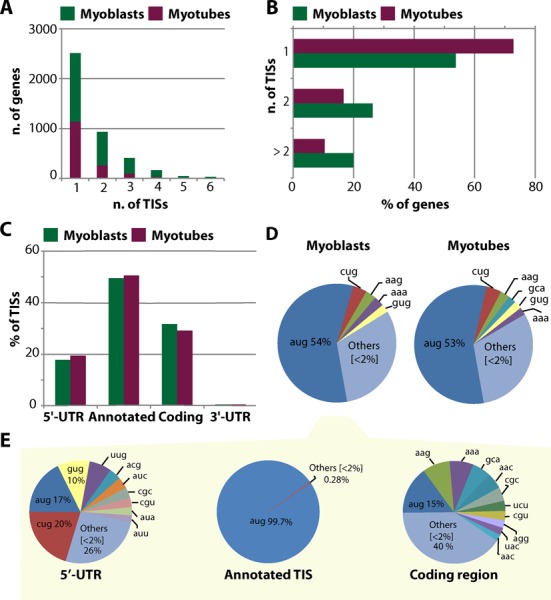
Alternative translation initiation sites used during myogenesis. Bar graph shows (A) the number of TISs per gene in myoblasts (green bars) and myotubes (purple bars), (B) the percentage of genes containing one, two or more than two TISs, (C) the percentage of TISs located in the 5′-UTRs, in the annotated start codons, in the coding regions or in the 3′-UTRs. Multiple indicates TISs mapping to more than one of the listed categories. (D) Pie chart shows the percentage of reads containing AUG and non-AUG codons at all detected TISs for myobalsts (left) and myotubes (right) treated with harringtonin. (E) Distribution of reads with AUG and non-AUG codons at detected TISs located in the 5′-UTRs, in the annotated start codons and in the coding regions. Distribution is shown only for myoblasts.