
Figure 1.
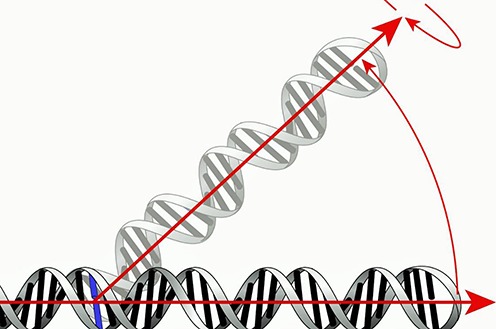
Illustration of how pivot points are identified. A rigid stem sequence from the two structures being compared is superimposed. The nucleotide mismatch or motif where one strand's increasing deviation from the next originates is the pivot point. The loop sequence that completes the pivot structure is shown in gray. The arrows show directionality toward the loop of the measured helices and the freedom of these helices to move in 3D space about the pivoting position. The arrows diverge from one another at the pivot point.