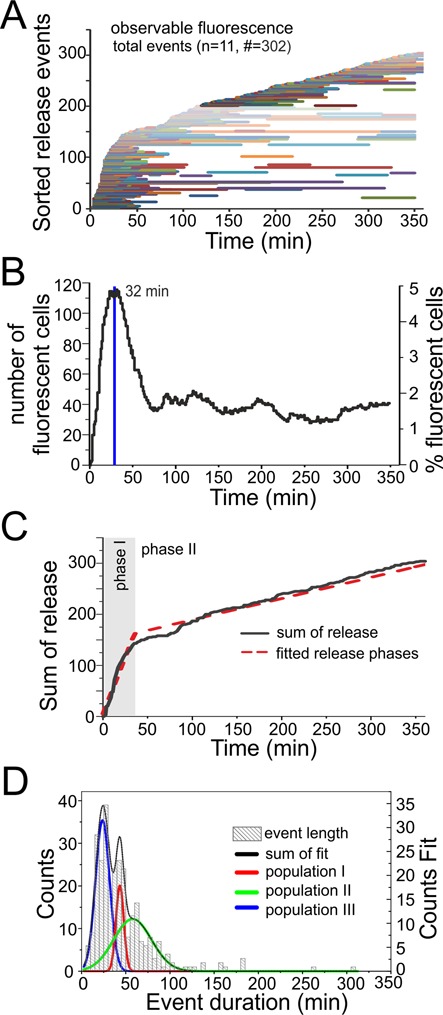
Figure 4.

Release analysis of Atto 488/Atto 590 siRNA transfected with cationic lipids. In total 11 live cell transfections were observed resulting in a total of 328 release events, with 302 release events within the first 360 min of observation (see Supplementary Movie M1 for an exemplary experiment). (A) Release events in chronological order of onset after transfection. Each event is represented by one horizontal line. Starting point indicates time point of release and the length the persistence time within the cytosol. (B) Percentage of fluorescent cells per observed time point after transfection (only full length events were counted). (C) Sum of release events over time resulting in two release phases with different release rates. (D) Histogram of fluorescence persistence time inside the cytosol before a depletion occurred (only full length events were included). Data were used to determine subpopulations which are indicated in red, green and blue.
