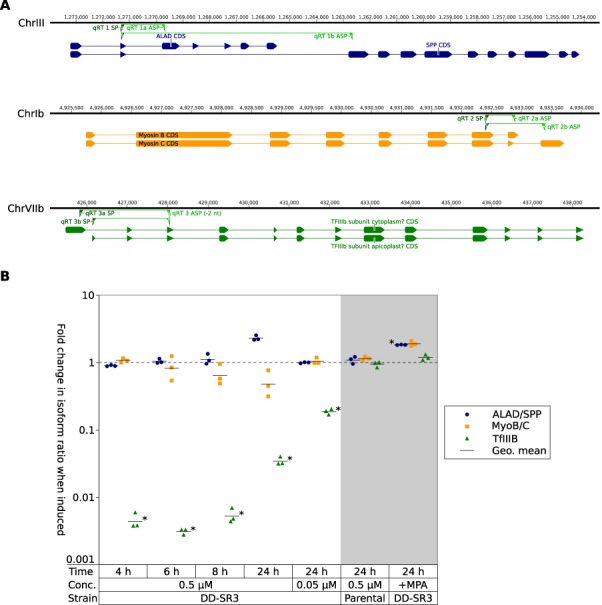
Figure 4.

qRT-PCR of three known alternatively-spliced genes. (A) Schematic showing coding sequence of isoforms tested. Numbers on horizontal axis indicate position in the chromosome, as per ToxoDB (39). Solid blocks indicate exons, and joining lines indicate introns (untranslated regions not shown). Green triangles show primer-binding sites (the 3’ end of qRT 3 ASP binds on the other side of the intron). (B) Change in isoform ratio between isoform A and B ( ) for these three genes, for different conditions as per the x-axis. The unshaded area represents addition of 0.5 µM Shld1 to the conditional mutant for 4, 6, 8 or 24 h; and addition of 0.05 µM Shld1 for 24 h. The shaded area represents controls: the parental strain with 0.5 µM Shld1 added for 24 h; and treatment of the mutant with 25 µg/ml mycophenolic acid (MPA) for 24 h. Horizontal lines show the geometric mean of triplicates. * indicates statistical significance with adjusted P value <0.05.
