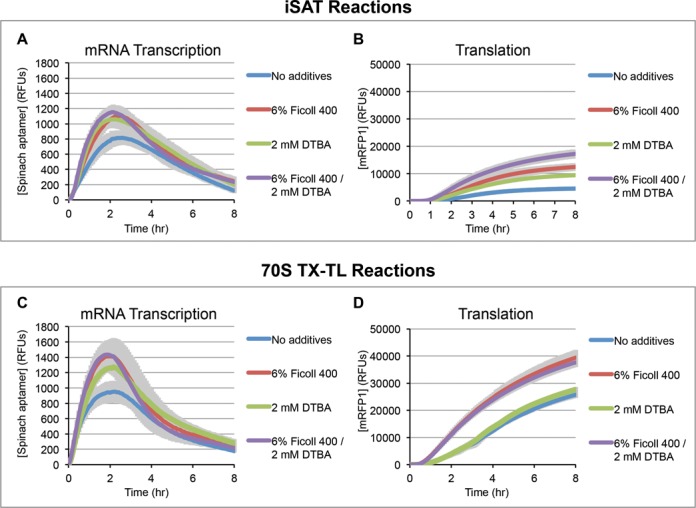
Figure 4.

Comparison of transcription and translation under crowding and reducing conditions for (A) mRNA transcription and (B) translation in iSAT reactions and (C) mRNA transcription and (D) translation in 70S TX-TL reactions. Reactions were performed with the mRFP1-spinach construct and the fluorophore DFHBI. mRNA transcription (A and C) was measured by green fluorescence of the spinach aptamer of the mRNA bound to DFHBI. Translation (B and D) was measured by the red fluorescence of mRFP1. Readings were taken every 5 min. Lines represent smoothed averages (n ≥ 3) and shading represents smoothed error bars (1 s.d.).
