
Figure 3.
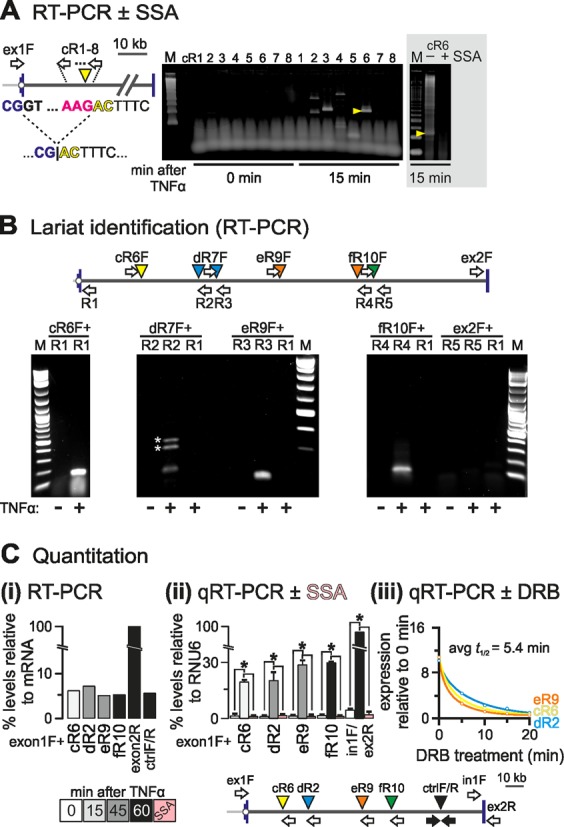
Detection of exon–intron product in SAMD4A intron 1. HUVECs were treated with TNFα for different times, total RNA isolated and DNase-treated, and hybrid RNAs or lariats detected by RT-/qRT-PCR. (A) Identification strategy. The map (left) shows SAMD4A intron 1 (exons 1/2: blue vertical lines) and primers used (white arrows; forward primer ‘ex1F’ targets exon 1 and is used successively with reverse primers cR1–8 targeting intron 1 at ∼1 kb intervals). The dotted line illustrates recursive splicing between the exon 1 donor (exonic sequence: blue; intronic: black) and an RS site (cR6, yellow arrowhead; acceptor sequence in red). The product loses the (canonical) donor GT to gain a (non-canonical) AC. Right: RT-PCR products were resolved by gel electrophoresis, gels stained and imaged (typical images shown; M: size marker), and all bands detected after stimulation (but not before) sequenced. One band (yellow arrowhead) possessed the hybrid exon–intron sequence (…CG|ACTTTC…) consistent with formation of a splicing intermediate. Gray box: pre-treatment (3 h) with 100 ng/ml spliceostatin A (SSA) abolishes the indicated band. (B) Lariat detection by inverse PCR. The map (top) shows the primers used for lariat detection. Each forward primer (e.g. ‘eR9F’) is used with a reverse one (e.g. ‘R3′) to amplify across the A nucleotide at the junction in the lariat; as controls, RNA from unstimulated HUVECs and pairing of forward primers with a reverse one at the 5′ end of intron 1 (‘R1’) were also assayed. *: spurious bands amplified using ‘dR6F + R2’. M: size marker. (C) Quantitation of RS products. The map (bottom) shows primers used for RT-/qRT-PCR. ‘Ex1F’ (targeting exon 1) was used with the reverse primers indicated, whilst the pairs ‘ctrlF/R’ (amplifying an intronic region with the Drosophila motif), ‘ex1F/ex2R’ (amplifying across the exons 1–2 steady-state junction), and ‘in1F/ex2R’ (amplifying across the intron 1/exon 2 boundary) serve as controls. (i) Levels of selected RS intermediates. Amplimers were resolved by gel electrophoresis, gels stained and imaged, and intensities of bands measured and expressed relative to that given by primers targeting fully-spliced mRNA. All intermediates are as abundant as the ‘ctrlF/R’ segment, and present at 4–7% the level of mRNA. (ii) RNA levels assessed by qRT-PCR and expressed relative to those given by RNU6 RNA (±SD; n = 3). RS hybrids are ∼20% the levels of primary transcripts and their formation is SSA-sensitive (pink bars). *: significantly different from 0 min (P < 0.01; two-tailed unpaired Student's t-test). (iii) Half-lives of RS intermediates. TNFα treatment was for 15 (cR6), 30 (dR2) or 45 min (eR9), and 50 μM DRB added 5, 10, 15 or 20 min before harvesting. Levels (±SD; n = 3) are normalized relative to those obtained without TNFα or DRB. The average half-life is 5.4 min.