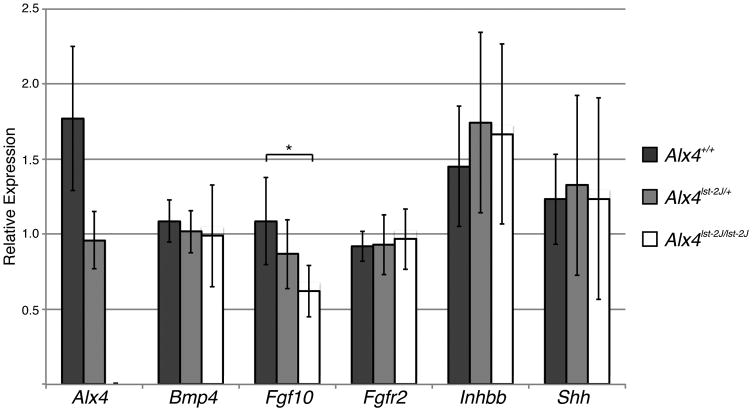
Figure 5.
Quantitative expression of markers of eyelid development in isolated embryonic eyelids. Expression levels of Alx4, Bmp4, Fgf10, Inhbb, and Shh measured by qPCR using Taqman probes (Applied Biosystems) on mRNA from microdissected E14.5 eyelids. For each gene, one WT sample is arbitrarily set to 1 and relative fold change calculated for the remaining samples. Asterisk indicates a significant difference (p<0.05) for WT versus homozygous for Fgf10 expression, determined by student's t-test. Sample sizes: WT=8; Het=9; Hom=9.

