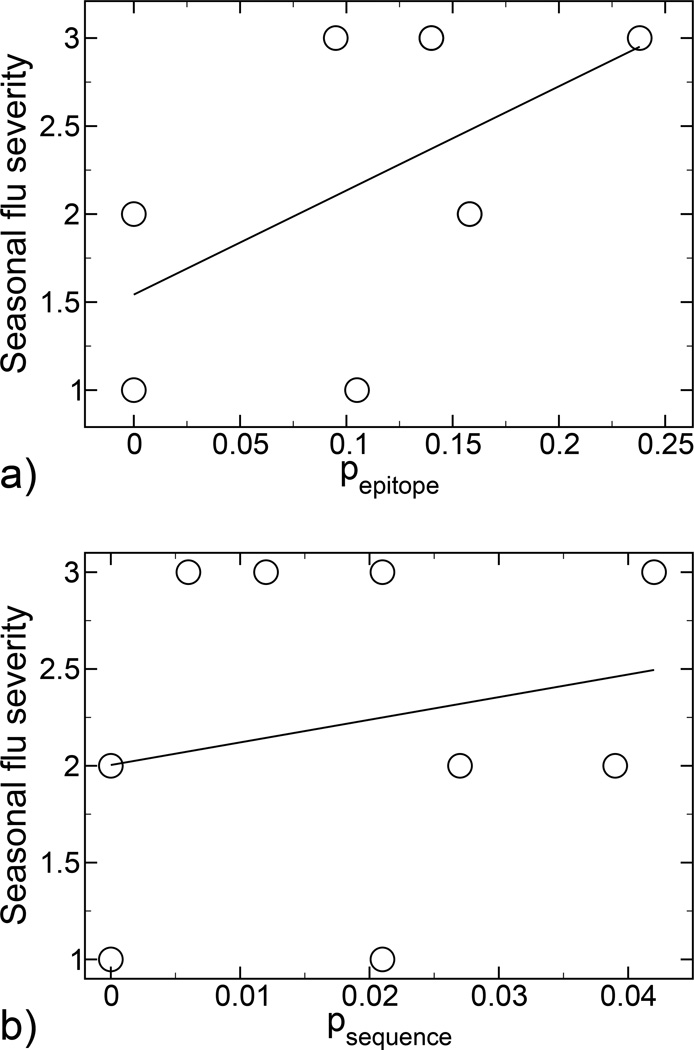
Fig. 2.
a) Correlation between influenza seasonal severity (see text) and hemagglutinin antigenic drift, calculated by epitope analysis. Least-squares regression analysis yields the linear fit y = 1.5425 + 5.9162 pepitope, with a correlation coefficient R = 0.54432. b) Correlation between influenza seasonal severity (see text) and hemagglutinin antigenic drift, calculated by whole sequence analysis. Least-squares regression analysis yields the linear fit y = 2.0041 + 11.684 psequence, with a correlation coefficient R = 0.2183.

