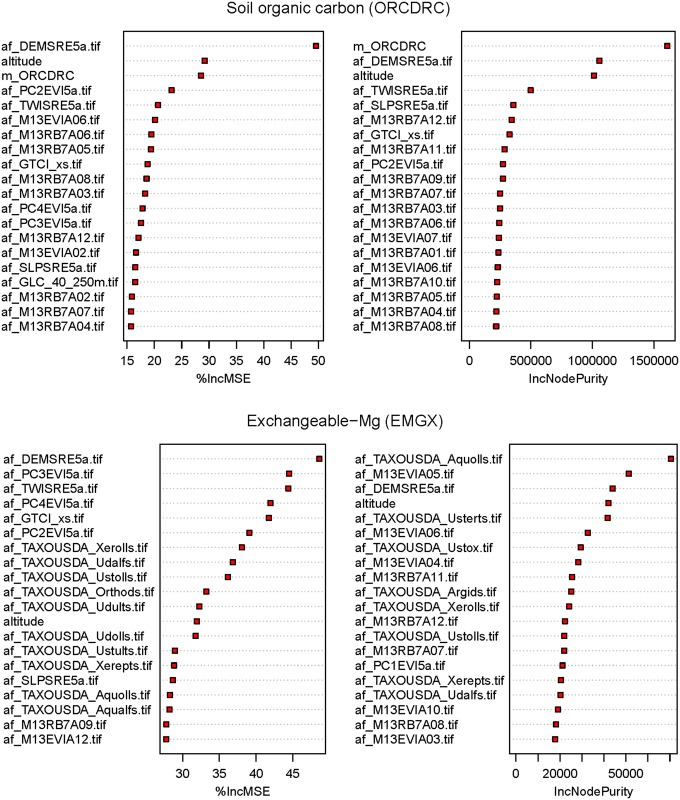
Fig 5. Importance plots for soil organic carbon and exchangeable Magnesium.
derived using the varImpPlot function available in the randomForest package [45]. m_TAXOUSDA_x are the predicted SoilGrids1km Soil Taxonomy suborders class probabilities, af_DEMSRE5a, af_SLPSRE5a, af_TWISRE5a are the elevation, slope and SAGA GIS Topographic Wetness Index derived at 250 m resolution, af_M13EVIAxx and af_M13RB7Axx are the long-term (2001–2013) standardized values of MODIS EVI and mid-infra red (band 7) products for months January to December, and af_PC1–4EVI5a are the first four principal components derived from annual MODIS EVI images (2001–2013).

