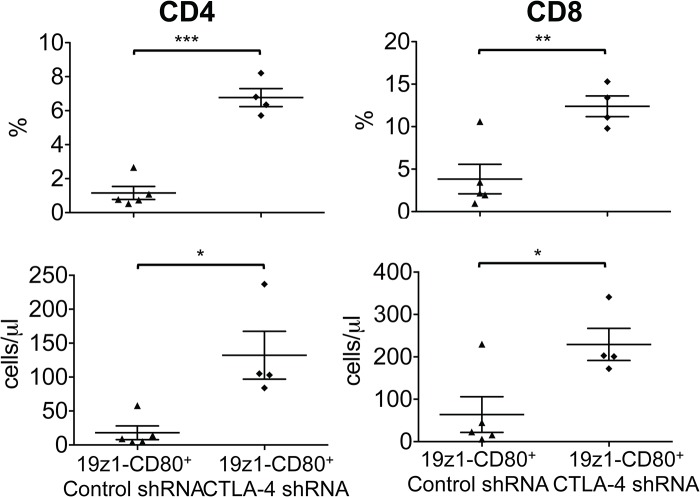
Fig 5. CTLA-4 down-regulation enhances in vivo expansion of 19z1-CD80+ T cells.
Diagrams show percentages and absolute numbers of circulating human CAR+ CD3+CD4+ and CD3+CD8+ T cells as measured by flow cytometry 15 days after T cell injection in NALM/6 bearing NSG mice. Each symbol represents an individual mouse (n = 4). *P<0.05; **P<0.01; ***P<0.001.

